Level up your New Relic monitoring
- 9 minute read
-
Every Acquia subscription includes a New Relic Pro account for application performance monitoring (APM). If you haven't tried it, claim your Pro account today.
It may take some time to develop familiarity with New Relic's interface as well as the unique performance attributes of your application, but don't be intimidated. In this hands-on guide, I will explain APM and leave you with four, simple tips you can implement today to get more out of your New Relic monitoring solution.
Intro to APM
The “APM & Services” page is a good place to start a hands-on exploration. Here you will find four graphs that New Relic uses to provide an overall picture of your application’s health:
- Web transactions time
- Throughput (in requests per minute)
- Error rate
- Apdex score.
Take a look at the primary graph ("Web transactions time"). The last 30 minutes of activity are displayed by default, but you may adjust the reporting window to reveal longer time frames such as 24 hours, 3 days, or even 12 months.
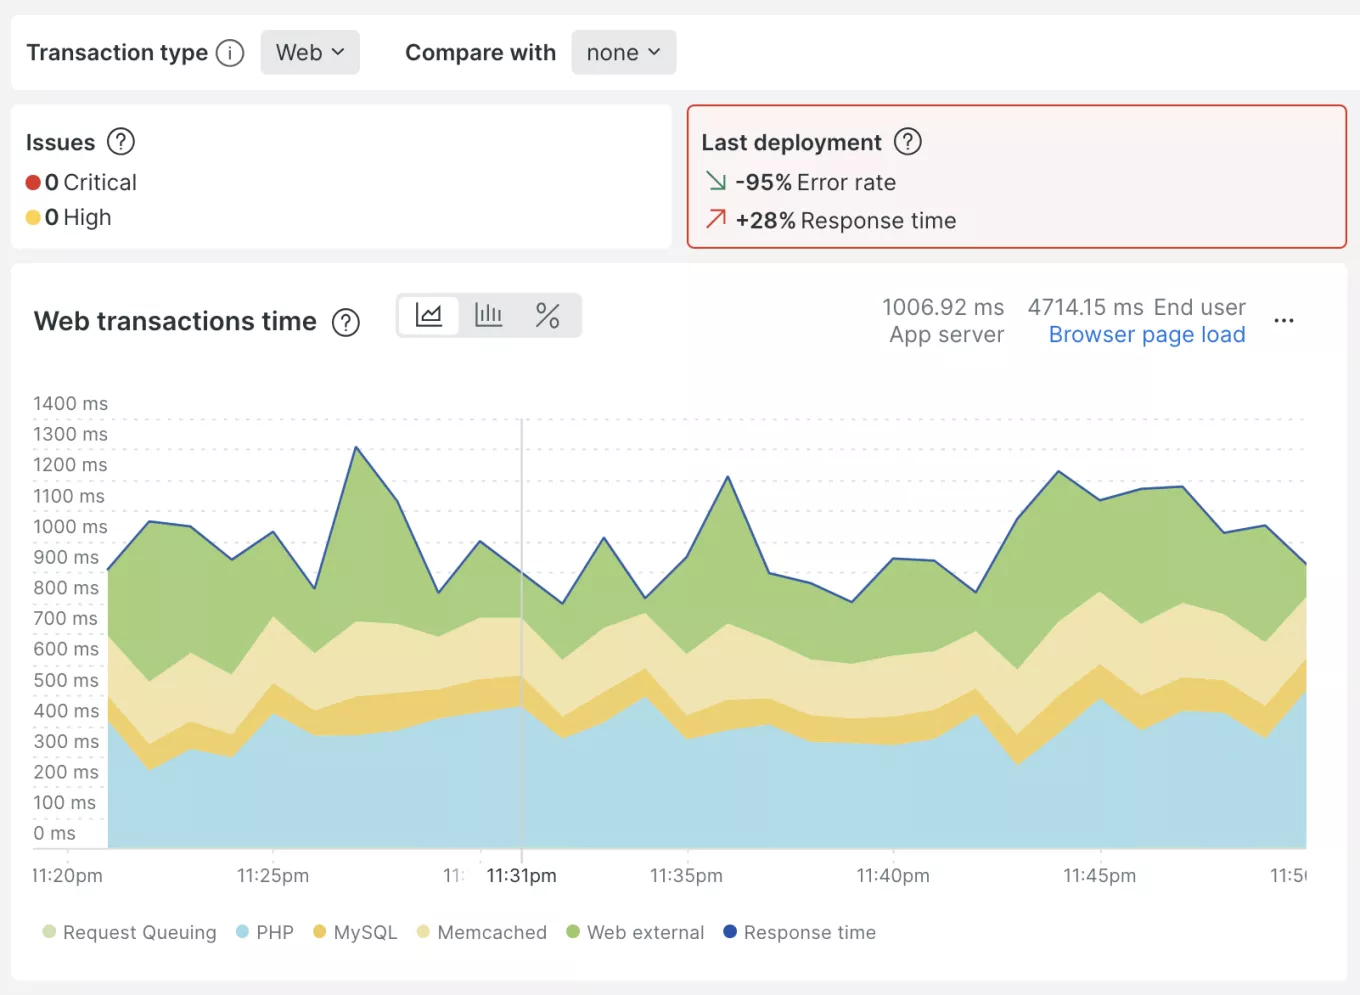
For most applications, your web transactions should be averaging one second (1000 ms) or less. High performing applications can easily achieve transactions times of 500 ms better. Your mileage may vary depending on your Drupal site architecture along with any custom functionality you have enabled.
How do I know if my application is healthy?
Compare the "Web transactions time" graph with the "Throughput" graph. As a general rule, your average response time should remain about the same when throughput increases significantly. In other words, your PHP transactions should be just as responsive regardless if your application are fulfilling 3,000 requests per hour or 15,000. On healthy applications, the trendline in the graph should stay relatively flat, or even.
If you see dramatic up and down variation, start digging into APM data until you understand the root cause for that variation. Perhaps your application has slow function calls or database queries, or long-running cron processes that are dragging down the average PHP response time. Note, if response times get worse when throughput goes up, this may indicate poor caching.
With a little practice, you should be able to identify your standard baseline performance simply by scanning the graphs, visually. Adjust the reporting window until you have identified a healthy-looking stretch of time where that trendline is relatively flat. Got it? Now you have what you need to calibrate your Apdex score.
What is Apdex?
Apdex (short for “Application Performance Index”) is a standard industry methodology that attempts to distill numerous technical data points into a single user satisfaction score. A perfect score of 1.0 means that 100% of your application's users are "satisfied," whereas a score (below 0.5) is considered unacceptable.
In Apdex terminology, a score below 0.5 means your users are “frustrated.” A middling score of 0.7 suggests users are “tolerating” your application performance — but it also means performance could be better!
Apdex is most useful in the context of your broader business objectives. What are the specific objectives of your application? Is it reduce the time it takes visitors complete a task? Is it generate qualified leads or increase webform submissions? Whatever your objectives, you should be monitoring your Apdex and aiming to improve the score over time. However, a challenge with Apdex is that no two applications are the same, so you may need to make some adjustments that are suitable for your business case.
By default, New Relic’s T value (i.e. "Threshold value") assumes that PHP applications will take an average of 0.5 seconds to fulfill dynamic requests. This may not be realistic; therefore, I want to show you how to recalibrate the T value using real-world production data.
Tip #1: Calibrate your Apdex score
To ensure your Apdex score is a meaningful metric, calibrate its T value. You will need your App ID which you can locate by visiting the services page. Click on “APM & Services” in the main menu, then click the small “…” adjacent to the application you want to monitor.
After you locate App ID, select “Query Your Data” from the main menu. Enter the query below (insert your App ID where appropriate):
select percentile(duration, 70) from Transaction where appId=<AppId> since 12 hours ago
What this formula will do is calculate a threshold that uses 70% percentile data to yield an Apdex score of 0.85. With this new T value in hand, complete your calibration by updating the Application settings (see screenshot, below).
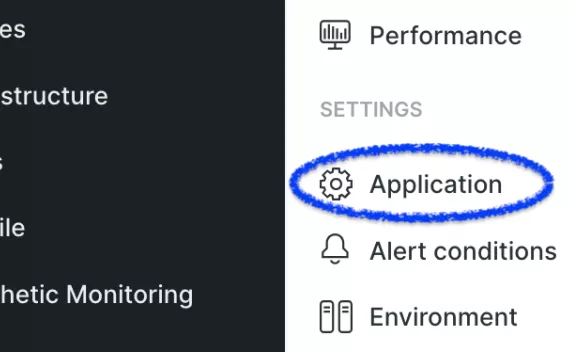
Finally, you will need a few days and return to New Relic APM to confirm your Apdex score is still trending at (or around) 0.85. If it isn't, you may re-run the calculation with different parameters until your baseline reflects an Apdex score of 0.85.
Obviously, 0.85 is not a perfect score. It is best to "leave room for improvement" when you calibrate your Apdex. The goal is to measure improvements over time and also guard against regressions. Let me tell you, it is very gratifying to see the Apdex score gradually improve over several weeks as the application becomes more performant.
You should recalibrating your Apdex once a year or so, as your application or business expectations evolve. (If you have a TAM, collaborate with them.)
Tip #2: Configure performance monitoring
As an application owner, you need to know when your users are frustrated. A calibrated Apdex is an excellent proxy for performance, so let's use it to trigger alerts when performance drops!
Navigate to the “Alerts & AI” page, select “Alert Conditions & Policies,” and select the option to create a “New alert policy.” Name your monitor “Apdex” and accept the other defaults provided. On the next screen, choose “APM” as shown:
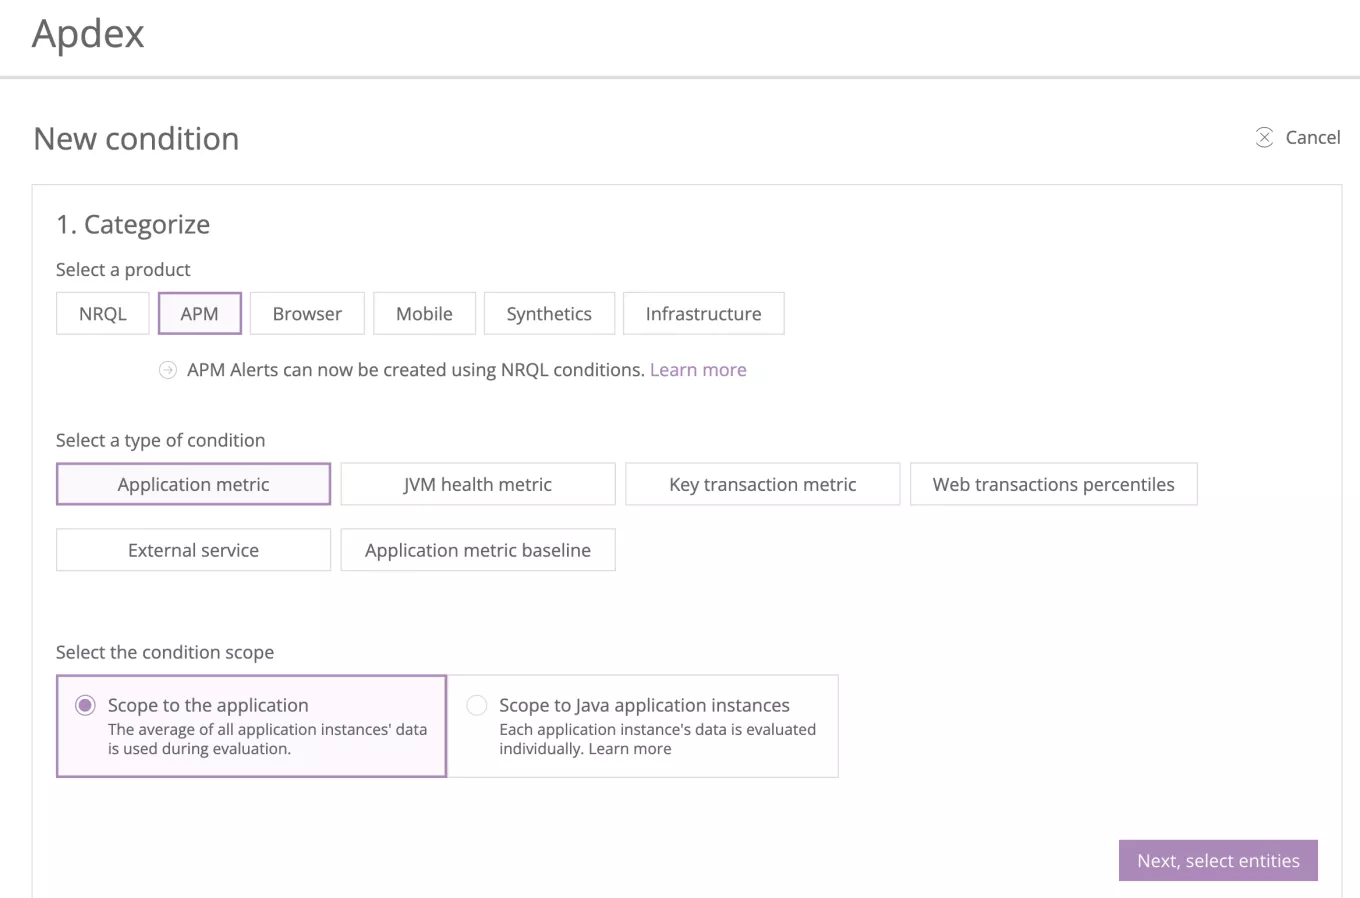
Click through a few more screens to where you will “Define thresholds.” Set up an alert for when the Apdex score drops below 0.5 for more than 5 minutes.
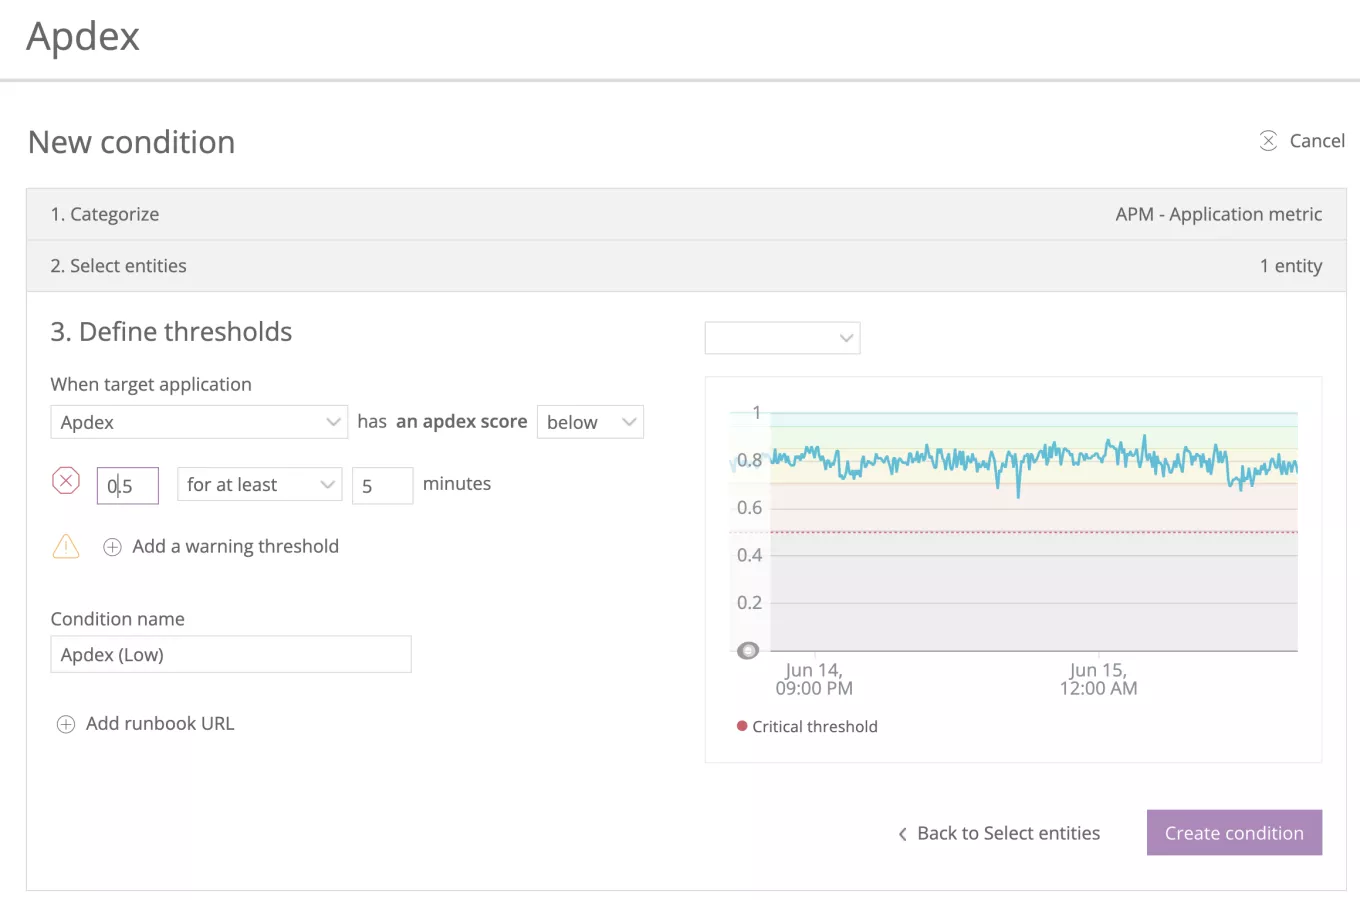
Since New Relic records all incidents over time, your team can review past performance and use past data support future performance optimizations.
Tip #3: Configure uptime monitoring
Ping checks are not part of APM, but they complement it very well. New Relics Synthetics offers Ping checks that will "poke" your site from multiple locations around the world. New Relic uses the aggregated data to compute your uptime percentage (daily, weekly, and monthly). You can even download these reports in CSV format to share with your team.
Of course, everyone has a goal of 100% uptime, but let's see how you do. From the main menu, select “Synthetic Monitoring.” Click where it says “Create monitor” then choose “Ping” as the monitor type. Finally, enter the URL of your Acquia-hosted application.
Please note: I recommend entering your origin hostname, not your public domain. On Acquia, the origin hostname takes the form of https://[docroot].prod.acquia-sites.com, where [docroot] is the machine name of your application. Although you could enter the public domain, customers with CDNs or 3rd party proxies may find that simple Ping checks are cached by the CDN, which could delay the early detection of problems within your Drupal application.
Tip #4: Implement deployment markers
If you implement this final tip, your monitoring strategy will come full circle. New Relic enables you to "mark" code deployments in the timeline to allow you to correlate configuration with any subsequent performance improvements or regressions.
Below, we see New Relic deployment markers overlaid on an Apdex graph. In this example, we see an Apdex score dropped from blue (excellent) to green (“satisfied”) and finally to yellow (“frustrating”). If you did not have a good monitoring strategy, such regressions may not be noticed until much later — after poor application performance is creating bigger problems for your business.
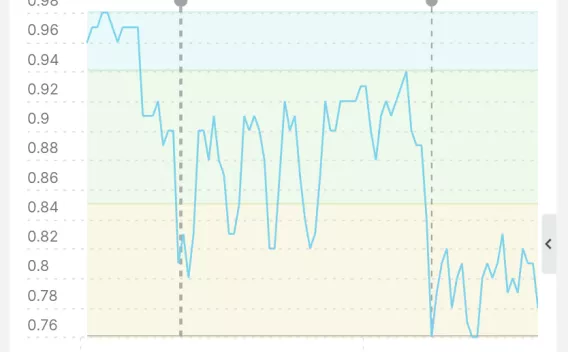
There are several ways to implement deployment markers: use the New Relic CLI, implement a custom script using PHP, or simply add the New Relic module to your Drupal codebase and configure it to deployment markers automatically.
The data provided by New Relic — when utilized effectively — will help demonstrate the business value developer work allocated to improving application performance.
Happy monitoring!


