Your website has been in production for months. Everything seems great until one day, you get a call. On the line is your client, clearly irritated, telling you he has been receiving lots of complaints about slowness on his website.
In order to identify the root cause of this issue, a developer can analyze the website’s source-code in search of some problematic function. But instead of analyzing the system manually, the developer can use a profiling tool such as XHProf.
XHProf is a profiling tool for PHP that is very fast and easy to use. Developed by Facebook, it’s a great choice for complex Web applications.
In this post, we will cover how to integrate XHProf and Drupal by using the XHProf module.
Installing XHProf
The Drupal community has written a post that covers XHProf installation in various environments. For that please check: https://www.drupal.org/node/946182.
Configuring the XHProf module
After enabling the module, you’ll need to configure it. In your Drupal instance, go to “admin/config/development/xhprof,” check “Enable profiling of page views and drush requests,” and save the configuration.
This will enable XHProf profiling for your site. To access the report for a given page, check the bottom of the page for an “XHProf output” link. This link will show the XHProf report, and how it relates to the current page request.
Analysing XHProf’s report
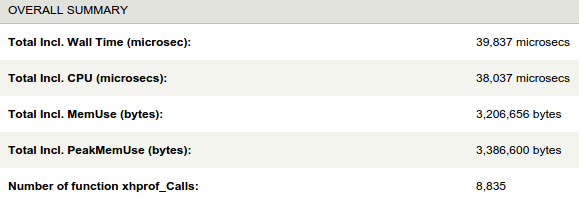
This report shows useful information about the recent request. It generates the page containing the time the server took to process the page (Total Incl. Wall Time) and the memory peak of the request (Total Incl. PeakMemUse).

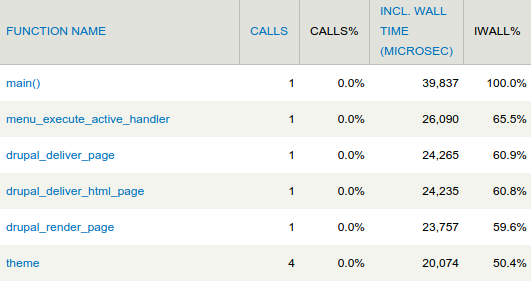
The most interesting part of this report is the table of functions, which can be sorted by various criteria such as:
Incl. Wall Time: Function total processing time
Excl. Wall Time: Function total processing time excluding the time used by calls to other functions within this function scope.
Excl. MemUse: Memory used to execute the function excluding the memory consumed by other functions within this function scope.

Compare two reports
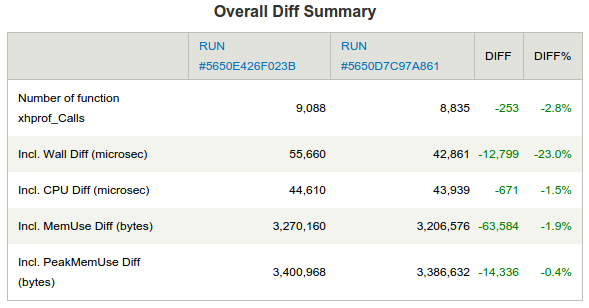
You’ll probably want to compare the performance between two runs. With the XHProf module this is easy.
Access “admin/reports/xhprof/” and choose the two reports you want to compare. The report ids will be used as url parameters in admin/reports/xhprof/diff/

Benefits of Using XHProf
By using the information gathered by XHProf, the development team can save a considerable amount of time, avoiding manual debugging of the performance issues.
The tool also serves well for scalability tests, as it can be used in testing environments that do not have much resource consumption. This feature may be most useful for projects that strictly need to guarantee a certain level of performance during usage peak times.
XHProf’s installation, and ease of configuration with Drupal, brings great value to the development team that uses it.
XHProf can save you hours of blind investigation.


