Understanding your stack will help you when a problem arises with your website. And as we mentioned in our previous post, it’s not so much if you are going to have a problem with your site, but when.
One of the best troubleshooters we ever worked with is a former sound engineer. He taught us, “Follow the signal, it’s all signal flow.” When you are working with sound, your stack consists of amplifiers, preamps, limiters, microphones, recording devices, speakers, just to name a few.
Running a website, your stack is the combination of hardware and software that you use to deliver your website, and the “signal” is a web request. To understand the “signal flow” of your site, you will need to understand your stack. Understanding how all of the pieces fit together lets you know where to start looking for the problems.
If you can identify where the signal breaks, then you can pinpoint the location where your web request has failed. This is essential when you’re troubleshooting an issue. For example, if you are getting a “PDO exception” on your website, you should start sniffing around database calls, not at your theme layer. Following the flow through your stack helps to identify this.
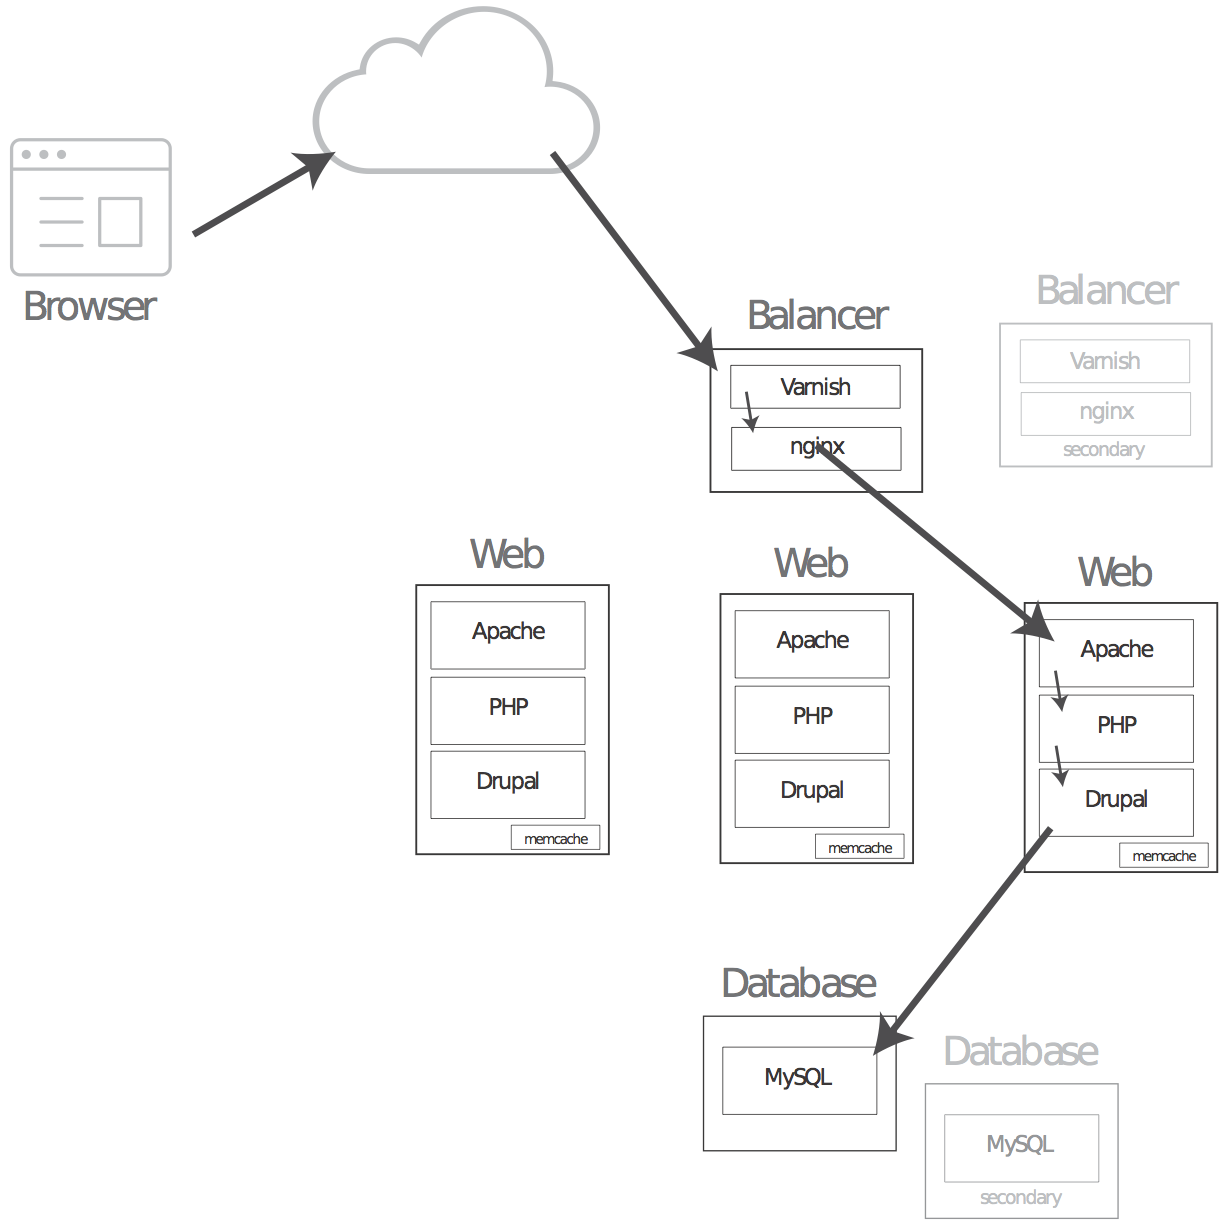
Let’s use the Acquia Cloud Enterprise stack as an example.

In this example, we have two servers loaded with Varnish for caching and Nginx for load balancing. They sit in front of multiple web servers that talk to one database.
The “signal flow” of a web request to this stack looks like this:
- A user--Athena--visits example.com in her browser.
- Athena’s browser makes a DNS request that turns example.com into the IP address of the load balancer.
- Athena’s browser sends a request to the load balancer.
- Varnish gets the request on the load balancer.
- Varnish then checks if the page is cached.
- If the page is cached, the request is returned to Athena’s browser by Varnish as a web page.
- If the page is not cached, the request is handed off to Nginx.
- Nginx decides which web server is next in rotation and passes the request on.
- Apache picks up the request on the web server.
- Apache sees that the page is PHP and passes it on to the PHP interpreter.
- The PHP interpreter evaluates the index.php file, which then connects to the database and bootstraps Drupal!
- Drupal kicks off, processes the request, generates the results (through its own, internal “signal flow”) and the web page is sent back to Athena’s browser.
As you can see, the web request “signal” flows through many steps. Problems can happen at any point along the way. The more complex your stack, the more places for potential problems to happen.
Note that we have greatly reduced the “Drupal” layer in the web request description above. Drupal has it’s own complex “signal flow” to render even simple pages. This flow includes converting paths, constructing dynamic pages and elements such as views, and panels. Additional modules each add their own functionality to the mix, too. Drupal’s “signal flow” is something we’d like to address in future articles.
Let’s look at a specific example in which a problem can be identified by following the flow of your signal.
Example - Troubleshooting a page redirect problem using signal flow
Your company is having a one year anniversary and they would like the "about us" page to redirect the page to special anniversary page. You have used Drupal’s Redirect Module to create a permanent (“301”) redirect to “example.com/anniversary” via the user interface (this is equivalent to manually adding the redirect command in your Apache .htaccess file directly with a Redirect 301).
However! When you visit “example.com/aboutus” you still see the old page and are not being redirected to “/anniversary”.
To kick off our troubleshooting, we are going to “curl” the URL to see what it tells us about the “signal flow” of our request in our stack, using the following in the command line:
curl -SLIXGET http://example.com/aboutus
According to Wikipedia, the cURL command comes from “see url”. We like using curl because it allows us to make a web request and see the results all on the command line. Examining the response there can show us things that are not as easily seen through a regular, full browser.

Let's break down that command:
- cURL: “Let me see this URL” and
- S: show errors
- L: follow redirects
- I: show headers only
- XGET: send this as an HTTP GET request
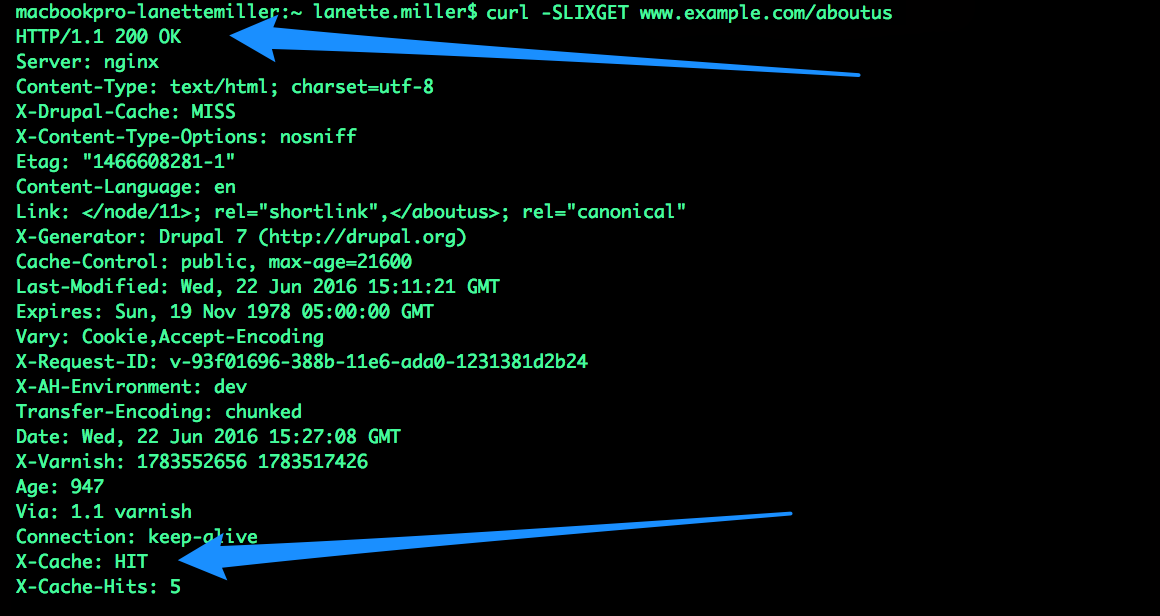
And here are the important parts of the response we got:
-
HTTP/1.1 200 OK- HTTP Status Code response 200 (“OK”). Normally a 200 response would be good (everything is okay!), but in this case we are looking for a 301 redirect response and it’s not there. -
X-Cache: HIT- This means that the page was served from the Varnish cache.
Looking at the signal flow of our stack, as described above, we know that Varnish is the first layer and it is still serving us our result. We added our redirect in the .htaccess file, which is an instruction set for our Apache web server. This means the request needs to make it further “down” the stack to Apache.
So next, we need to get a request past the cache level. We’ll do that by curling in what we call a “cache-buster” in the URL. Like this:
curl -SLIXGET http://example.com/?cachebust1234
What’s a cache-buster, you ask? Varnish caches whole pages by URL. This means that once “http://example.com” is cached, Varnish will then serve that page every time we ask for it in the browser. Adding “/?extrastring” makes it a different URL. If that URL does not match a real URL, then it would never have been requested, therefore would not be cached in Varnish. The cache-buster therefore bypasses Varnish and gets passed to Nginx, which then passes the request along to one of your Apache web servers.

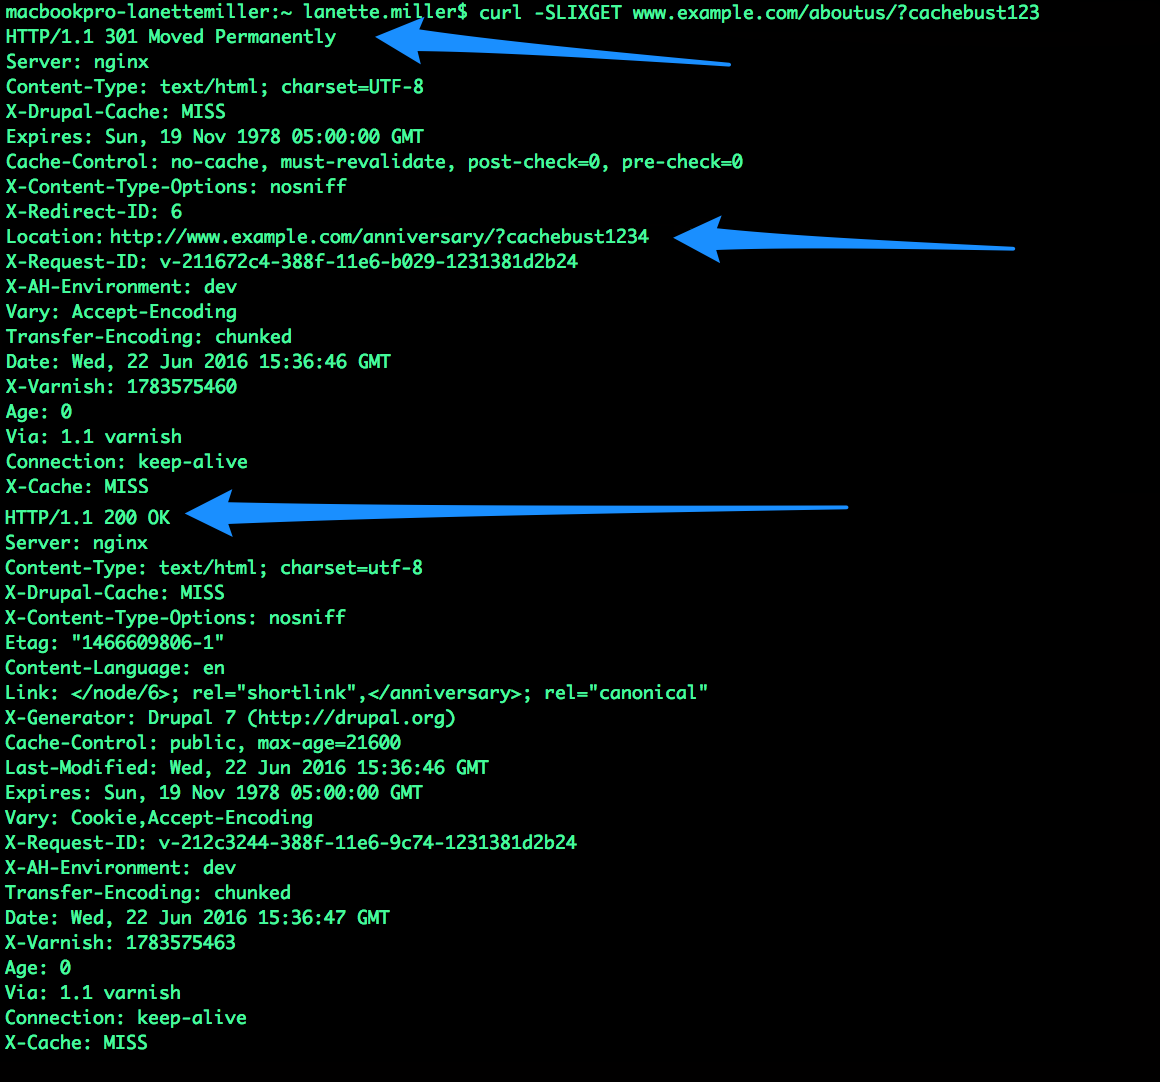
We can see two important things in the results of the cache-buster query:
- The first request:
- HTTP/1.1 301 Redirect - The first request returned an HTTP Status Code 301 redirect (“Moved Permanently”).
- X-CACHE: MISS - This response not served from Varnish.
- The second request:
- HTTP/1.1 200 OK - returned a 200 (“OK”) for the URL example.com/anniversary.
- X-CACHE: MISS - This response not served from Varnish.
We are getting the result we want (the new page) when we add the cache-buster to the URL. Now we know the problem is at the Varnish level; Varnish still has the original URL in its cache. And all we need to do is purge “example.com” from the Varnish cache and we should be all set! This is How to manually purge a page from Acquia Cloud Varnish cache. The documentation also explains some other ways of doing it, too.
Learn your Stack, Know your Flow
Knowing how your stack is put together and how it’s “signal flow” works--the paths web requests and responses take in and out of it--will help you diagnose problems you encounter easier and faster. Now it’s time for you to go find out how your stack is put together; it’ll make you a better troubleshooter!


