Stack Metrics allows you to see the underlying health of your site infrastructure.
We want you to have the tools and data you need to make informed decisions. With Stack Metrics, you can gain insights into the health of your fleet and narrow down the possible causes of performance issues without contacting Acquia for help.
With Stack Metrics you can also better plan for your long-term needs by monitoring trends and preparing for eventual upsizes, rather than being surprised when performance and site health start to suffer because your infrastructure has reached its capacity limits.
In short, Stack Metrics allows you to work smarter and faster, which saves time and money, and helps you optimize the health of your applications and your fleets.
By keeping an eye on the underlying health of your infrastructure, you can more easily track trends and determine whether changes in application performance/availability (data usually found in an Uptime Monitoring service or APM) correlate to resource utilization or exhaustion on your instances.
Overall, Stack Metrics tracks more than twenty metrics, too many to list individually. But let’s go through the four major tiers of metrics.
LOAD BALANCING
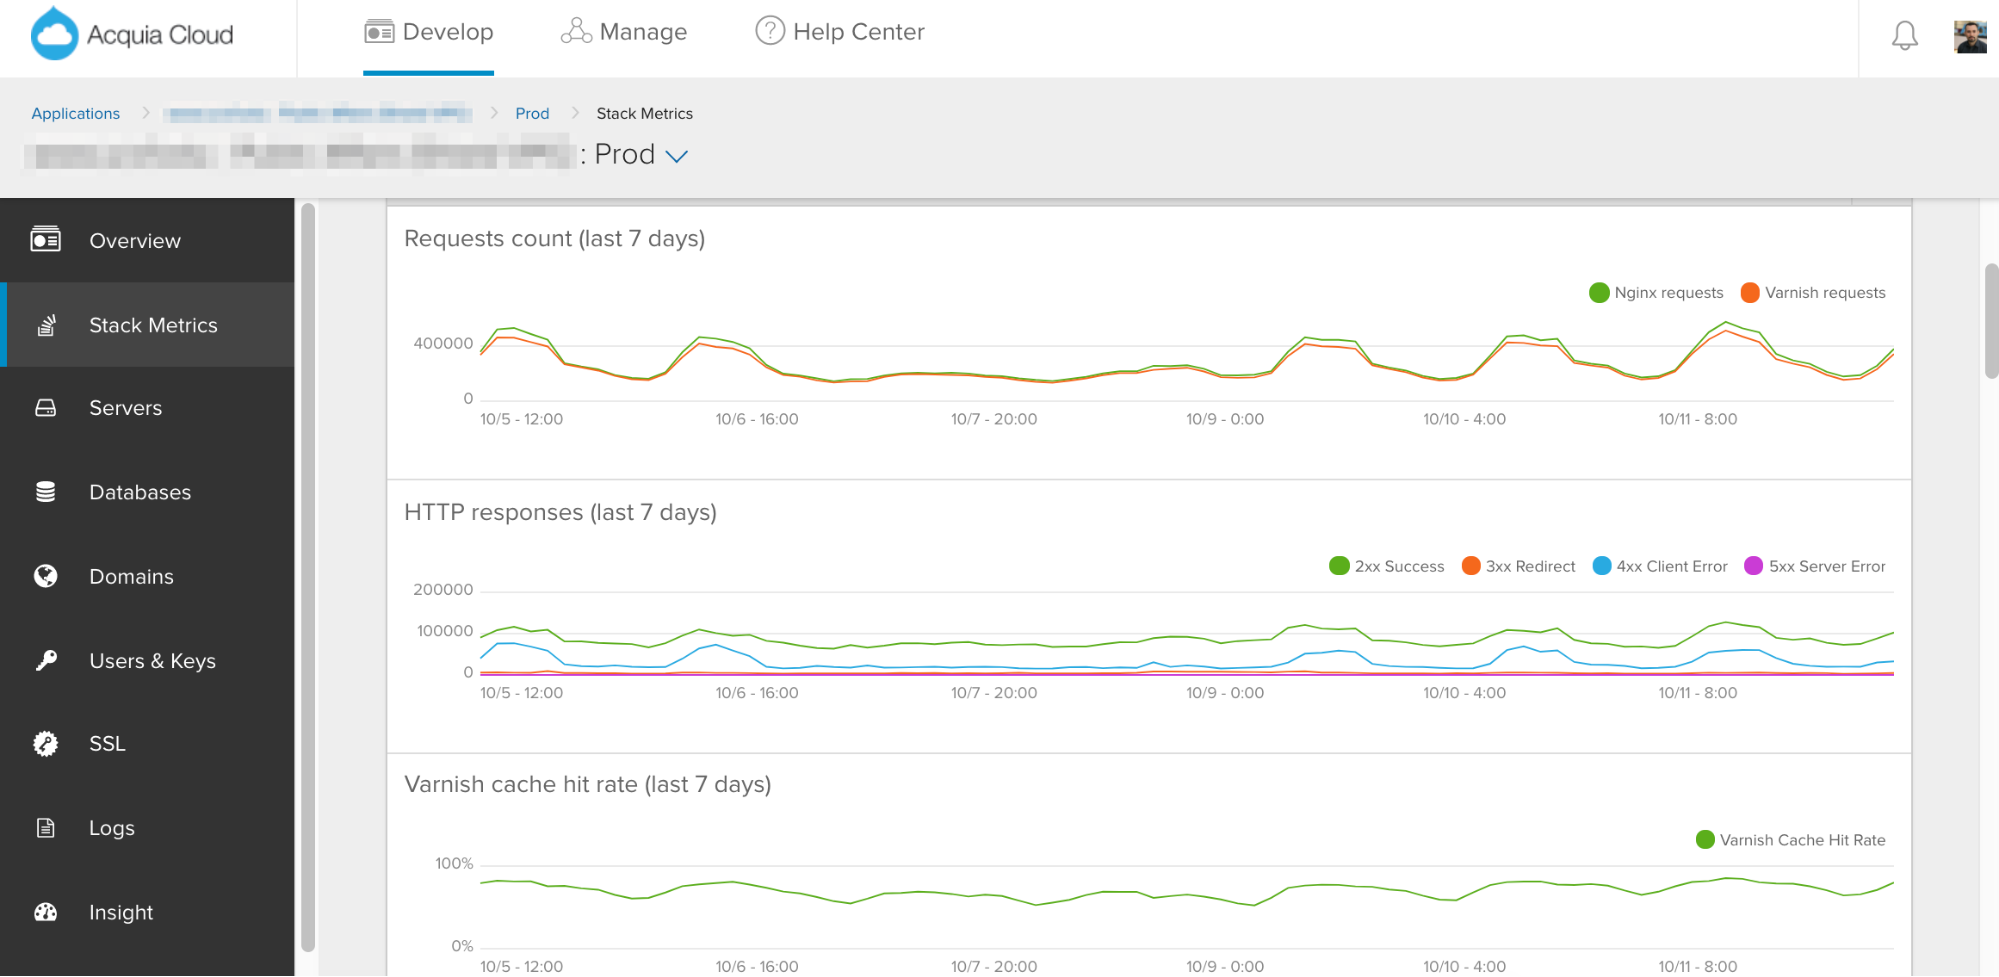
The first metrics we show you in Stack Metrics focus on traffic patterns, since that is so often the cause of site performance and stability issues.
We allow you to see an analysis of request volumes on your infrastructure, then break down the cache hit rate we’ve detected.
 Stack Metrics makes it easy to identify trends in traffic patterns and response codes.
The higher the cache hit rate, the more performant your site will be. We also summarize response code trends so that you can determine if your sites are generating too many 300, 400, or 500 responses in comparison to your rate of 200s (successful requests).
WEB TIER
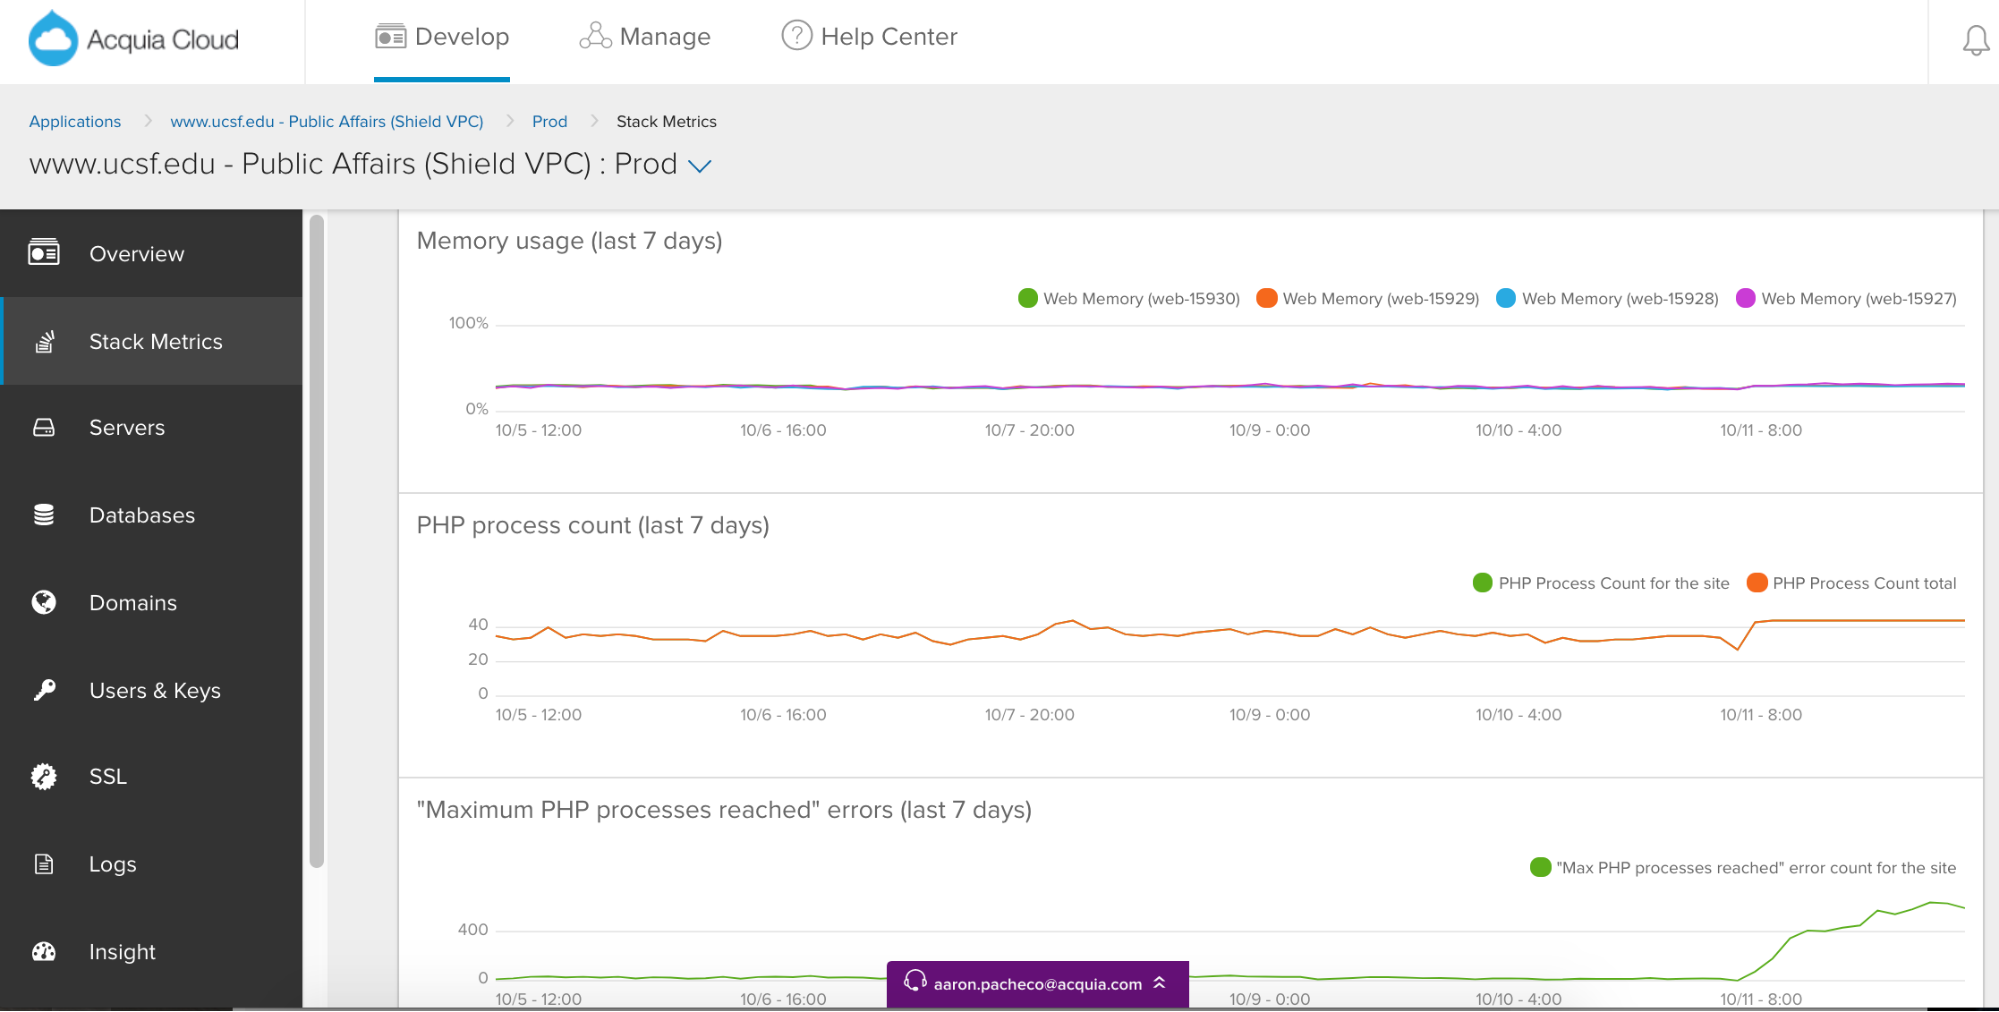
Web Tier analytics show how many requests are reaching the backend servers after bypassing caching. PHP processes are the little workers that handle each request that hits the backend, so we’ve decided to expose this metric to help you assess their true web capacity.
 Insights into Web Tier health can make it easy to spot anomalous behaviors and trends.
If you have clusters with multiple applications on them, you can see how many total processes are being used on each cluster, then compare that to how many a specific application is using by comparison.
This is useful for determining which are the most or least active applications you manage.
We also expose a metric that indicates PHP Process Exhaustion, a condition that can cause the site to slow down during periods of elevated traffic. Keeping an eye on this metric will allow you to determine if performance enhancements are needed or if you should consider requesting a proactive upsize prior to a planned high traffic event.
Cron memory utilization monitoring allows you to visualize the impact of your cron jobs. Often, cron jobs that attempt too much work, or which run too frequently, can cause site impairment or performance issues.
FILE SYSTEM / DATABASE
The main essential metric we expose to you on the database tier is Slow Query Count. This indicates that a database action took longer than one second to complete, which is unusual on most sites.
While relatively harmless in isolation, too many of these occurring at once can cause the site to slow down while the database tries to process all of the queries it has received.
Exposing this metric allows you to keep an eye out for a relatively silent performance killer that can often be eliminated with the help of a slow query log or an Application Performance Monitoring tool like New Relic.
We also expose File System and Database storage capacity and utilization metrics so that you can keep an eye on how quickly your file system or database storage is filling up and take action if you notice that it’s getting closer to capacity.
GENERAL
CPU/Memory utilization is shown at each layer of the stack so you can more readily assess if certain activities or times of day are more resource intensive than others. This is another common cause of intermittent performance/availability issues, and will help you determine if you need to upsize, optimize performance, or can otherwise safely downsize your infrastructure and reduce costs.
Further, out of Memory Errors are exposed as a warning sign that some aspect of your application is causing your instances to reach an “out of memory” state.
While these errors are known to happen from time to time, and usually only impact the specific process that needed too much memory, repeat occurrences can indicate the need for a performance audit by Acquia Support or additional server resources.
SUMMARY
We want you to have the tools and data you need to make informed decisions. We also want to empower you to be able to check into the health of your fleet, and narrow down the possible causes of performance issues on your own, without needing to contact Acquia.
Stack Metrics also heads off those sudden Surprise! realizations that you’ve reached a capacity limit. Instead you can be monitoring and preparing for upsizes long in advance.
The bottom line (literally): Stack Metrics allows you to work smarter and faster, optimize the health of your applications and your fleets, and save time and money.
If you are an Acquia Cloud customer, you can start using Stack Metrics today. Just sign in to the Acquia Cloud interface, select your application and environment, and click “Stack Metrics” in the left menu.
Not an Acquia Cloud customer? Learn more about this leading cloud platform that enables you to continuously develop, deliver, and run digital experience applications and content.


