When you spin up sites for a living, velocity is important. The developers at Acquia understand this, which is why we’re always looking for ways to make website development simpler and easier. Because that equals faster.
Many of our customers are already using these tools and practices. But we’d like to spread the word further.
We know you’re facing really challenging situations. We’ve got tools that will help you get past them, without taking up an entire afternoon. We can speed you up, and speed up your team.
In this series, we’re highlighting four ways Acquia can streamline the website-building process. In our first segment, David Stoline, Acquia Cloud Engineering Manager, focused on Simple Code, Workflow, and Local Development.
Today, Kanish Sharma, a product manager at Acquia, covers...
Richer Status Notifications and Troubleshooting
There are several tools out there that help developers build sites fast. However, once the sites are built, you have to keep them up and running, and performing as expected. That’s a big challenge.
Identifying bugs, for example, is extremely painstaking and time consuming -- requiring a manual process to collect all the metrics that may help you understand what is impacting performance.
Getting a granular view of your overall site health, and quickly identifying which patches need to be applied, or how code can be improved, is next to impossible.
Developers often work in teams -- making it difficult for DevOps to keep track of the code each developer is writing and deploying. This is a major contributor to site performance and downtime.
A lack of automated tooling has resulted in a very manual process, causing developers and DevOps to go on blind investigations when problems occur.
Acquia has identified the above pain points and invested heavily in building more, and better, troubleshooting tools than any other platform provider. These tools provide status notifications for you to get a clear idea of what is going on, and in many cases offers instant fixes to overcome any problems.
Acquia’s tools include ten that will improve your troubleshooting prowess:
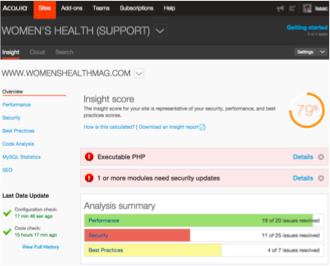
Acquia Cloud Insight uses over 200 rules to analyze your site’s configuration, performance, and security for risks and best practices. It produces reports, quality scores, proactive alerts, and actionable recommendations for issues it discovers with your code and configuration.
Acquia Cloud Uptime constantly monitors your sites to ensure they are online and actively serving content.
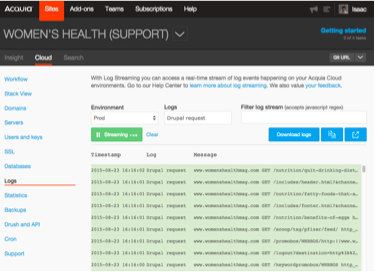
Log Streaming displays granularly-filterable logs from all servers in real time as end users browse your websites.
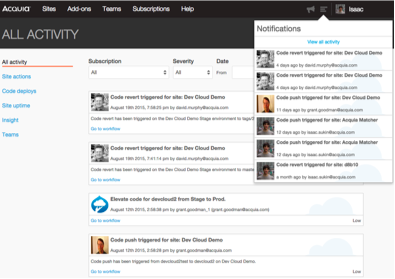
Activity Stream enables users to audit developer activity, identify when and why code changes were made, and determine which team is responsible for the changes.
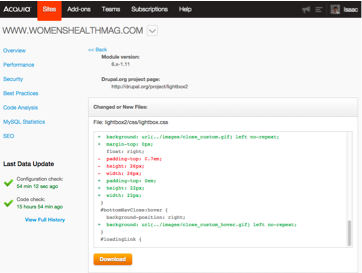
Module Analysis tracks changes made to your modules, identifies improper changes, and indicates if a particular module is out of date.
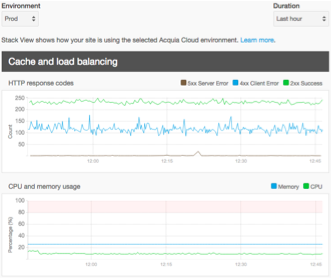
Stack View provides a view of how websites are performing, the corresponding infrastructure usage, and identifies and fixes application errors easily.
Acquia Site Review gives you access to granular information like error logs, slow query logs, disk space usage, web server error logs, php error logs, apache error logs, and more.
XDebug, which is integrated with Acquia Cloud, allows you to set a breakpoint and pause the execution of a script to see the state of your application at that exact point, including what variables/objects have been instantiated and what their values are. Xdebug completely replaces the need to litter your code with echo, print_r(), or var_dump() calls, and displays information on all variables, not just the one you passed. It also allows you to change the values of one or more variables on the fly, affecting the execution of your application.
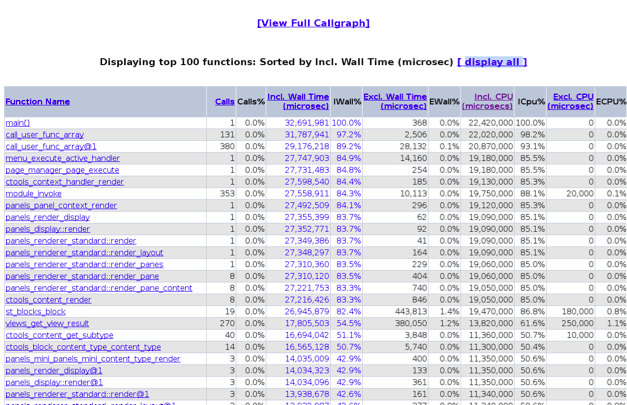
XHProf provides information that allows your dev teams to save considerable time avoiding manual debugging of performance issues. The tool also serves well for scalability tests since it can be used in testing environments. This tool is most useful for projects that need to guarantee a certain level of performance during usage peak times.
New Relic Application Performance Monitoring (APM) is a web app performance management tool that lets IT teams monitor live Drupal (and other PHP) apps, troubleshoot issues, and tune for optimal performance. New Relic APM Lite is available free to Acquia customers.
Acquia’s world class support team, strategically placed around the globe, will help you get the most out of these tools whenever you need help -- 24 hours a day. In addition, Support and Documentation is now tightly integrated into one (Drupal 8) site -- which means there’s just one stop for all your questions.
With other platform providers, you don't get all of these tools integrated as one solution. You will be required to either perform tasks manually, or spend significant time, effort, and money in engineering the functionality into your platform - and then allocating the resources to maintain it.
With Acquia Cloud, you start off with all these tools already installed and integrated into your platform. This allows you to get started quickly, and accelerate from there.
.

