Welcome to Post #2 in my series about debugging in Drupal 8.
If you haven't read my Introduction, the reason why I decided to create this series is that a lot of Drupalists use ”legacy” ways of non-interactive debugging based on php-native commands. Even though it's completely valid to use these commands to quickly display the value of a random variable, and to do simple (re-)search based on that, they have significant drawbacks compared to real interactive debugging. In this series, I will show you the basic steps on how to to set up debugging on a few commonly used developer environments.
Let's start with Preconditions:
- The latest versions of following applications are installed on your PC (as of July 2016):
- Mac OS X El Captain
- Acquia Dev Desktop 2
- Google Chrome latest
- Installed Drupal 8 site you want to debug running inside of Acquia Dev Desktop 2. In my example, the site is called blted8.
Acquia Dev Desktop 2 setup
1. Open Acquia Dev Desktop / Preferences, tab Config
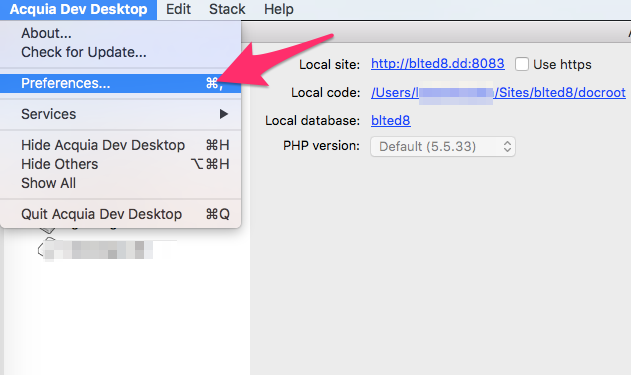
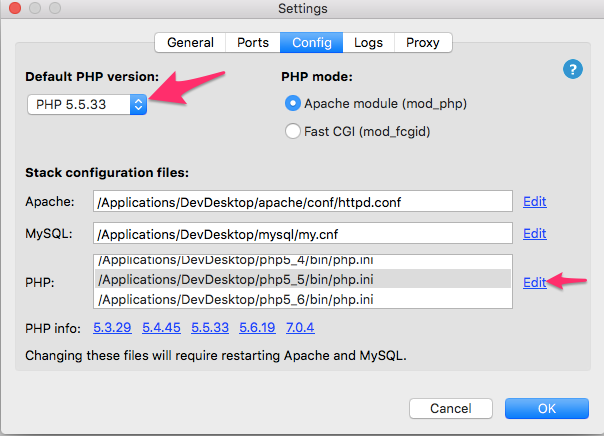
2. Select the php.ini which corresponds with the PHP version chosen as Default and click "edit"
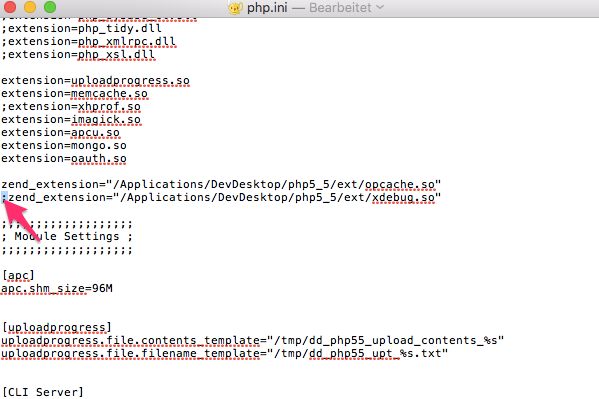
3. Uncomment the line (remove semicolon) pointing to xdebug.so file
4. At the very bottom of php.ini, add following two lines: xdebug.remote_enable=1 xdebug.remote_log=/tmp/xdebug.log
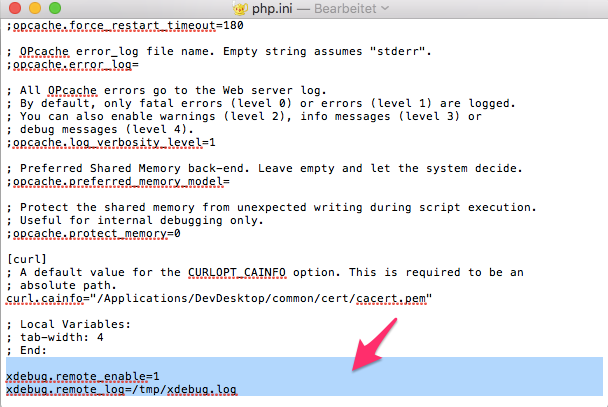
While the second line is not completely necessary, setting up a log will significantly help you to troubleshoot if debugging is not working properly.
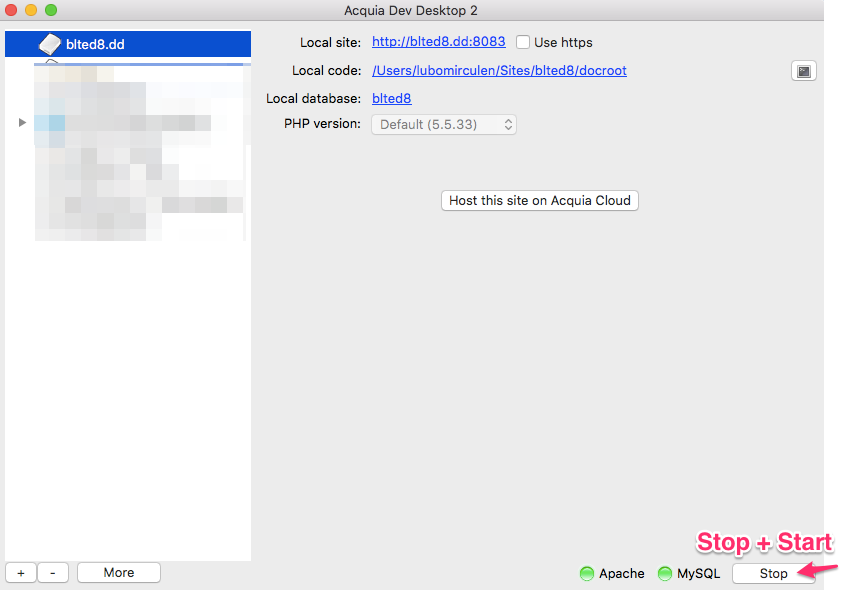
5. Close settings window and restart apache and MySQL on the Acquia Dev Desktop main window:
PhpStorm Setup
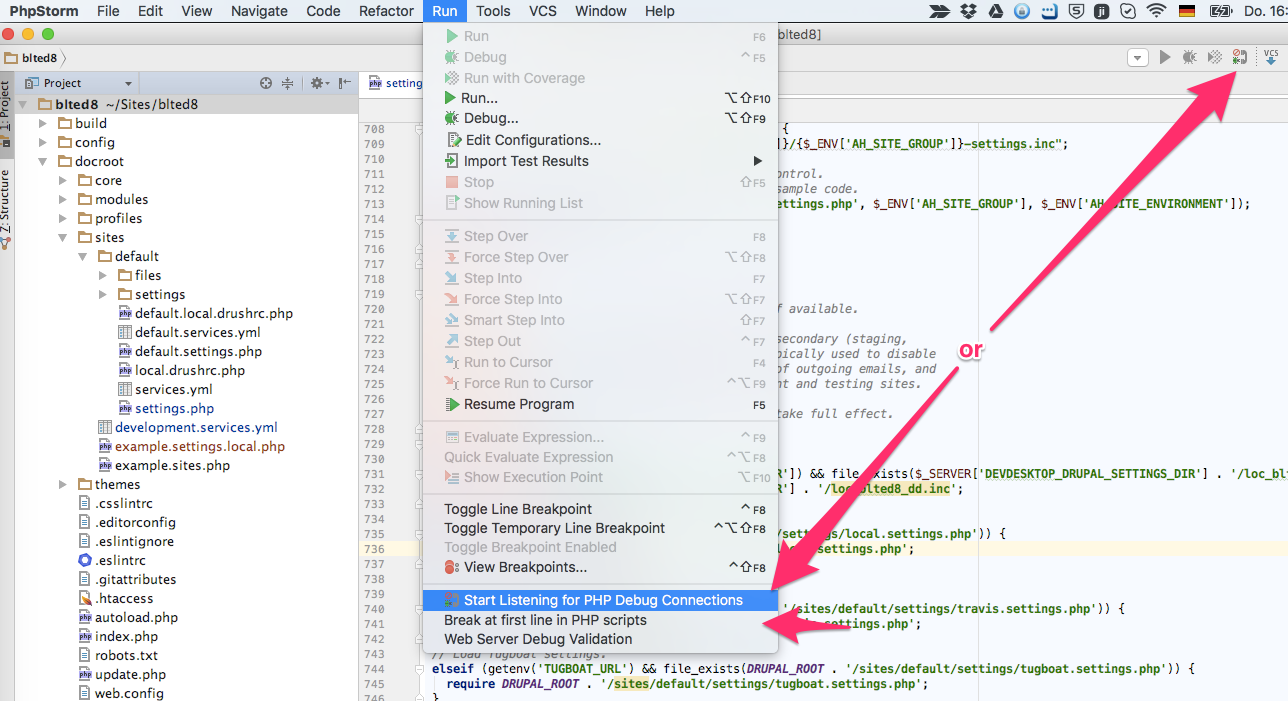
Unlike in the past and in another IDEs, you don't need to set up almost anything in PhpStorm! It listens to all the debug connections automatically by pressing one magic "phone" button or selecting in menu “Start listening for PHP debug connections” in menu "Run."
But because we want to be sure debugging is not dependent from some breakpoints we set in the code, we also switch on "Break at first line in PHP scripts" option below:
Google Chrome setup
1. Install extension Xdebug Helper
2. Leave all its settings default, you will not need to change anything for PhpStorm
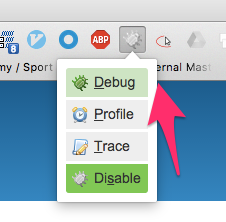
3. Switch the grey Xdebug icon on Google Chrome toolbar to green
4. Refresh the browser (cmd+R).
If everything was set up correctly, you should see how PhpStorm detected an incoming connection.
Note: if you don't see this screen, see the Troubleshooting section below.
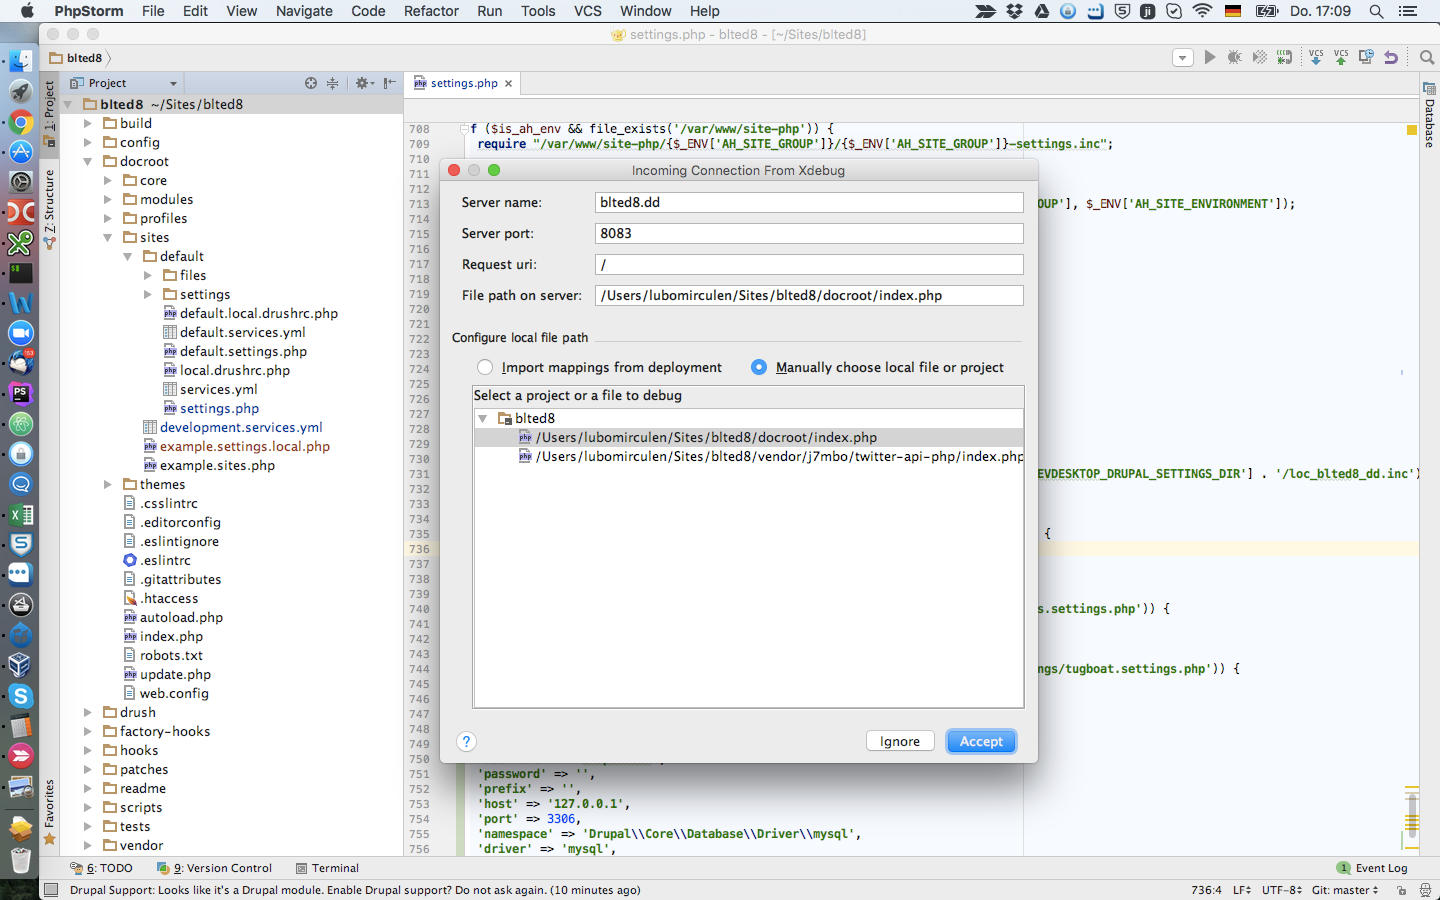
5. Select the line which points to document root of your Drupal 8 installation (in my case it’s blted8/docroot/index.php) and click "Accept“
6. PhpStorm stops at first line of index.php file you selected.
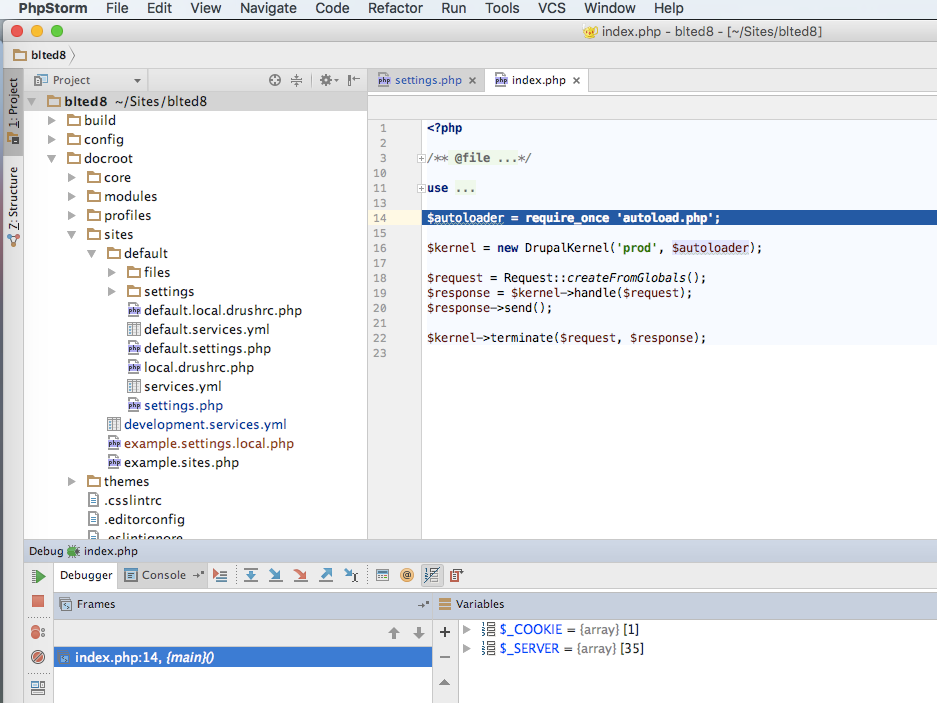
Debugger stopped at first line of index.php file, because we selected "Break at first line in PHP scripts“ in Run menu. Now it is obvious that debugging connection works, so we can switch this option back off and set some breakpoint in the Drupal 8 code to see some more information.
7. Set breakpoint somewhere in the code. In my example I'm setting breakpoint into core/lib/Drupal/Component/DependencyInjection/Container::get(), line 137, because I want to see the services system reads into the DI Container together with their parameters.
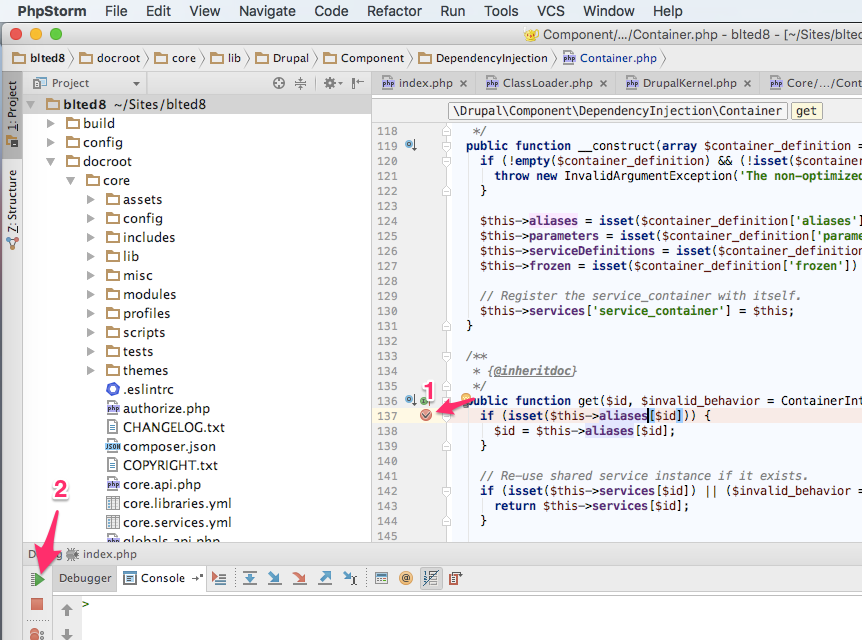
After clicking the red “play” button, application script should stop at the line you set a breakpoint on. Let's take a closer look at the debugging window now:
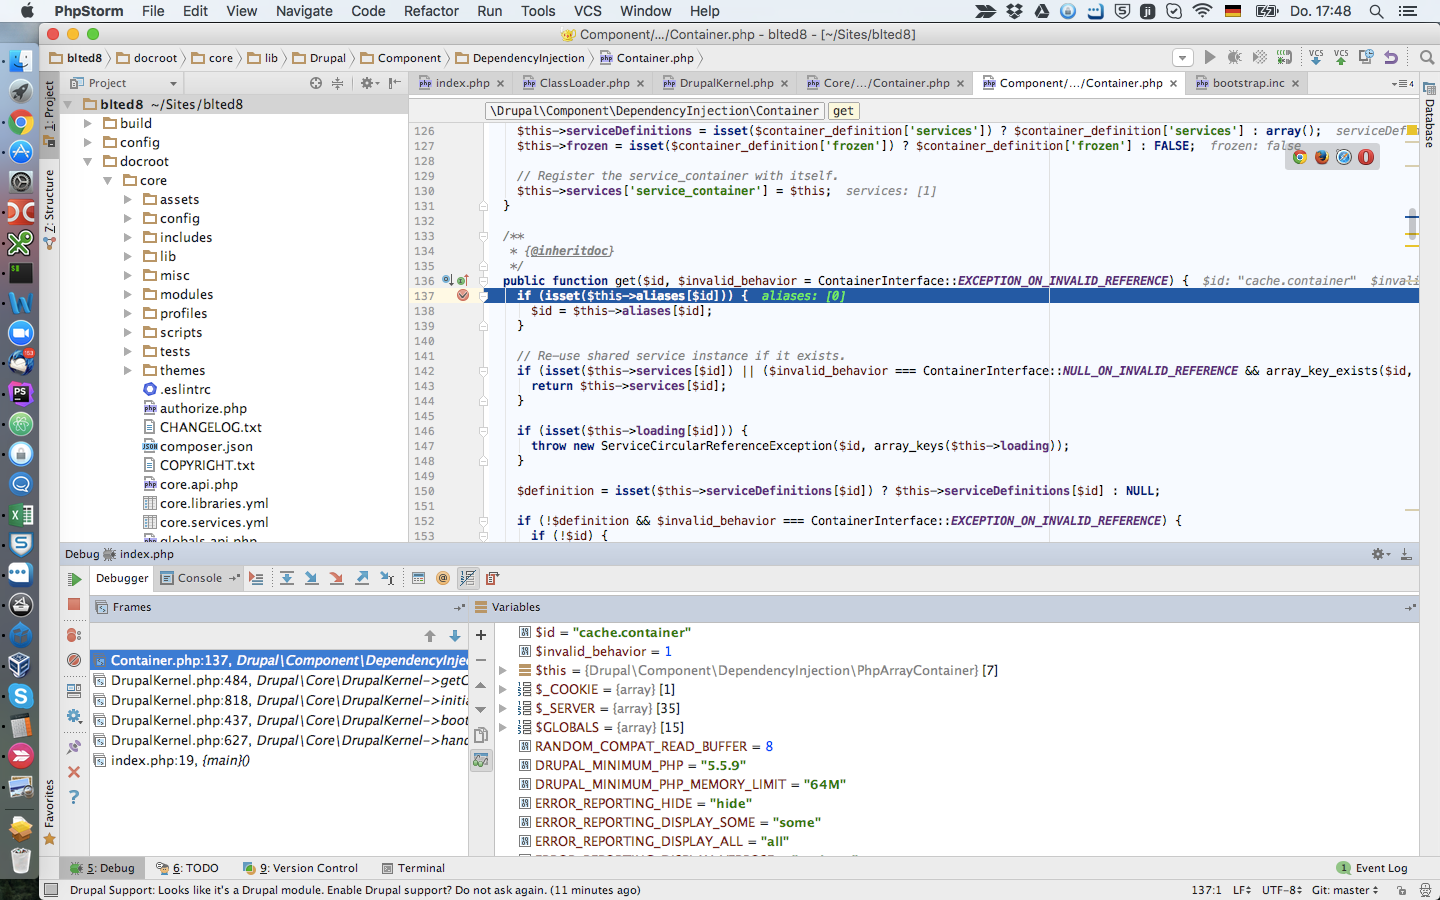
- In the “Frames” window at bottom-left side you can see the backtrace route of the script you are running. Similar to debug_print_backtrace() command, but with a significant difference: you can click on every trace and see actual variables when the function below was called. Incredibly helpful!
- In the “Variables” window at bottom-right side you can see a list and values of variables currently available to the method you are inside. Objects and arrays are expandable, so you can jump inside. In addition to that:
- You can see all PHP globals which are part of each PHP script
- You can set values to simple variables like strings and continue running the code with changed variables
- You can navigate forward in the script with the keyboard shortcuts or arrows near the Debugger tabs. You can step forward, step into method, step out, run to the cursor, set the list of methods to ignore and much more
- You can not navigate backward in the script because of nature of the debugging. To navigate "backward“ you need to stop debugging, set the breakpoint to the sooner state of the script and refresh the page.
Troubleshooting point 4:
Browser stays open and it seems that a page is loading forever
Switch the application to PhpStorm and check if debugger is perhaps still not active (=red “run” arrow in bottom left corner is active). A very common case is that debugger is active in the background and the window on PC only didn’t switch properly. In this case the script runs "forever" until debugger is stopped / page is loaded.
Page was loaded completely without debugger being stopped
Debug connection doesn't work. Sometimes it helps to check /tmp/xdebug.log to determine if xdebug was loaded at all. If not, you need to go back to original steps and ensure xdebug extension is correctly loaded in php. Use phpinfo(); command inside of any script and search for "xdebug“ here. Important value is "xdebug.remote_enable“ which must be set to "on“ or "1". If you don't find Xdebug in the info file text at all, xdebug extension was not loaded. In that case, double check the line you uncommented in Acquia Dev Desktop (step 3). Does the file exist? Especially on Windows machines often happens that some backslashes and spaces in names are not correctly translated (check how other paths in php.ini are displayed in Windows). You can also check apache logs for possible errors in this case.
The window with script selection is skipped - debugging directly breaks at first line of php script
This is normal behavior, it happens if there is only one possible index.php file to be debugged in the project or if the file was already chosen by previous debugging attempt.
PhpStorm opens debugging screen with message in "Variables" window like: "Cannot compute source position“ or similar
PhpStorm cannot determine the file you haven't stored in your local project repository. For browser-based debugging this usually happens if you have more projects you are trying to debug with different code bases – and you have accidentally the wrong project opened. So you need to open exactly the right one you are accessing from the website. There may be also different use-cases for this issue when you are debugging from CLI. I will describe later in next, third part of this blog.


