Before you read this, you should review a previous installment of this series: Debugging Drupal 8 in PhpStorm: Local Web-based Debugging in Mac OS X, Acquia Dev Desktop 2, and XDebug. The reason is that PhpStorm stores a lot of settings automatically when debugging is invoked from the browser for a first time. Because we don't want to insert these settings manually, and we want to leverage them for CLI debugging, we're assuming in this documentation that the web-based debugging environment has been correctly set up, launched, and run at least once.
So, ready? Let's go.
1. Check and write down the server name of your application in PhpStorm:
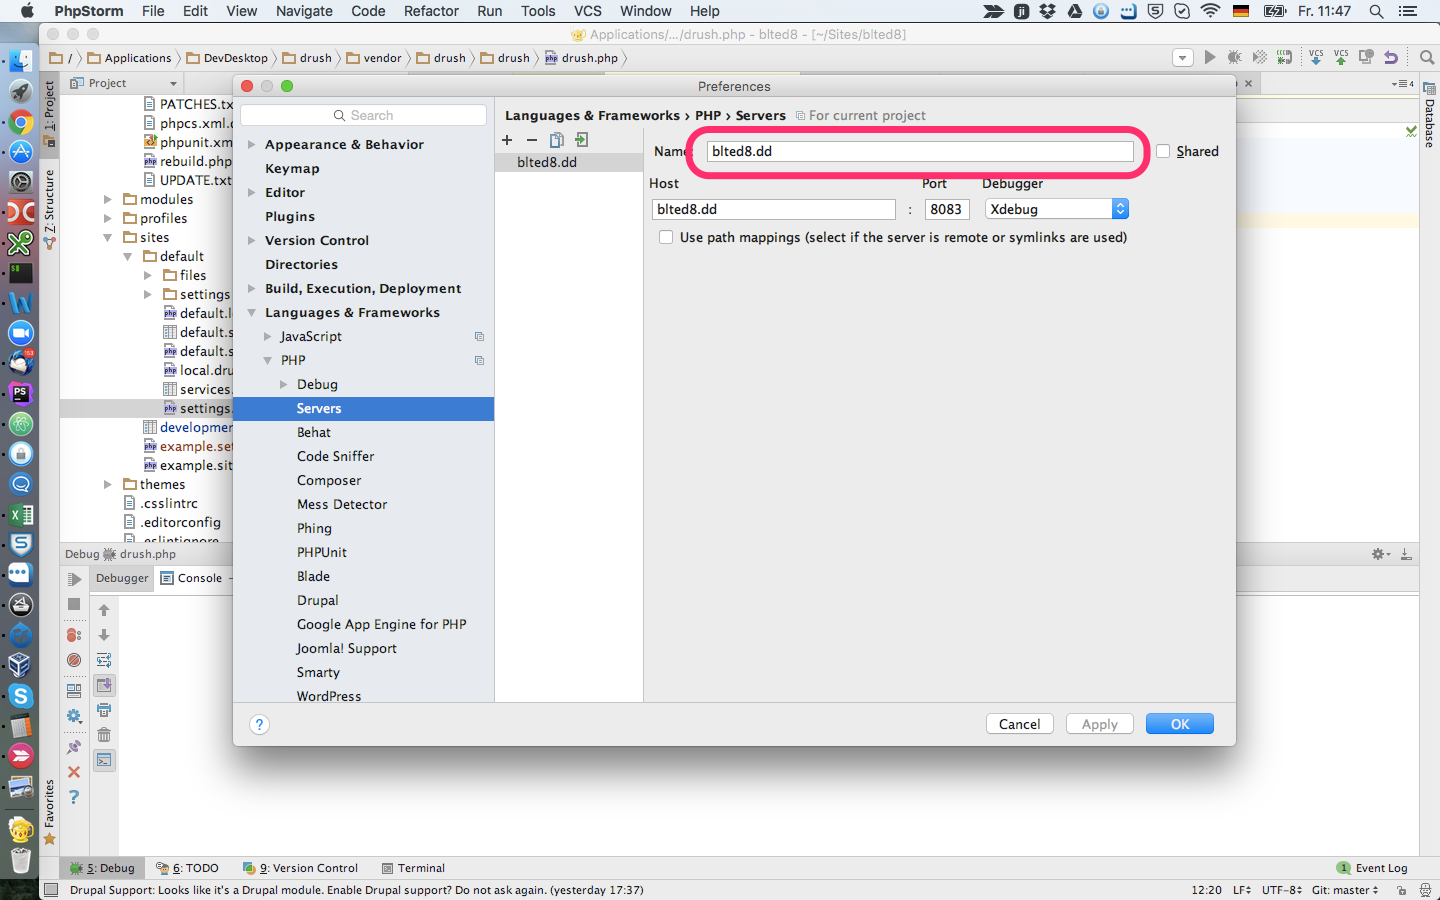
You will find this window in PhpStorm / Preferences, section Languages & Frameworks / PHP /Servers.
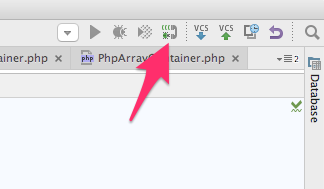
2. Ensure the "phone"-button in PhpStorm is active and PhpStorm is listening to PHP debug connections:
3. Edit file ~/.bash_profile with your favorite text editor, or from the Terminal by typing nano ~/.bash_profile and inserting the following lines at the end of this file: XDEBUG_PATH="/usr/lib/php/extensions/no-debug-non-zts-20121212/xdebug.so" # Change this to your path to xdebug.so export PHP_IDE_CONFIG="serverName=blted8.dd" # Change blted.dd to your server name from point 1 alias phpdebug='XDEBUG_CONFIG="remote_enable=on" php -dzend_extension=$XDEBUG_PATH' alias phpunitdebug='XDEBUG_CONFIG="remote_enable=on" php -dzend_extension=$XDEBUG_PATH $(which phpunit)' alias drupaldebug='XDEBUG_CONFIG="remote_enable=on" php -dzend_extension=$XDEBUG_PATH $(which drupal)' alias drushdebug='XDEBUG_CONFIG="remote_enable=on" drush' # pointing to DevDesktop drush and its own php script where we already set set up browser-based debugging
You may need need to update the following values in this file:
- XDEBUG_PATH: please insure that the path to xdebug.so is valid and the file is present here. In the standard installation of Max OS X 10 this file should be present, but it may be different in the time you will be trying this. You can find the correct path by typing
sudo find / -name xdebug.so. - serverName: change text
blted8.ddto your server name you’ve got from PhpStorm in point 1
4. Close your terminal window and restart it, so the changes in .bash_profile will take effect.
5. Change to document root (typically docroot) folder of your Drupal application and type phpdebug index.php
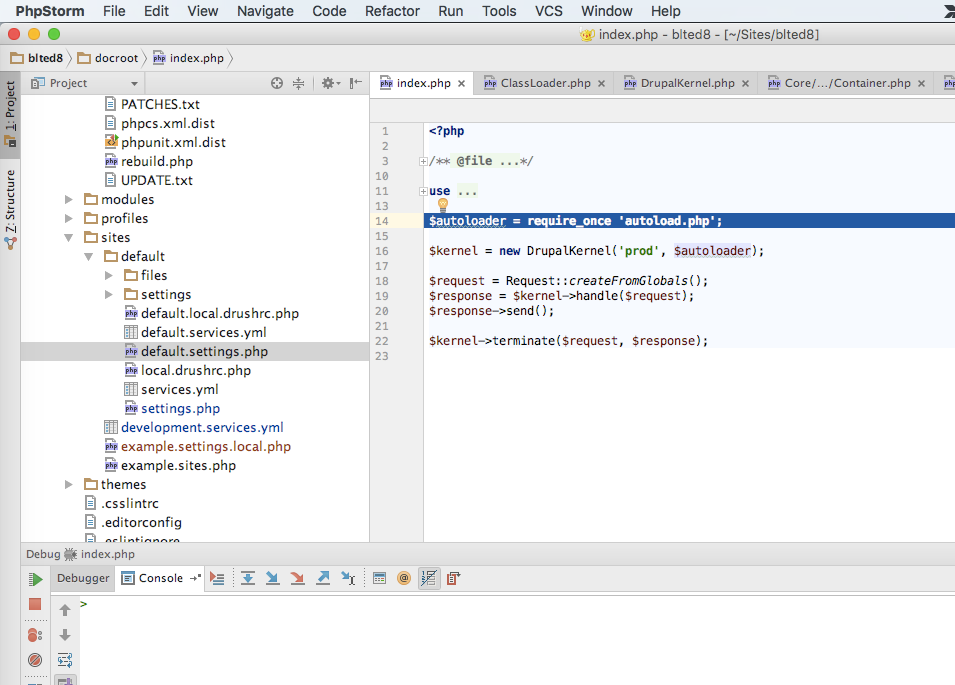
6. Switch to the phpStorm application and you should see debugger stoped at first line in PHP script:
Troubleshooting intermezzo
This step is very important, therefore let's stop for a while and check some common cases if the debugger is not working correctly:
- PhpStorm invoked debugger somehow, but it's not behaving correctly
- First check if you correctly inserted your server name into PHP_IDE_CONFIG. This is the most common cause. You can determine this if PhpStorm is not showing debugging cursor in source code, but it is offering you the red debugging arrow to run through:
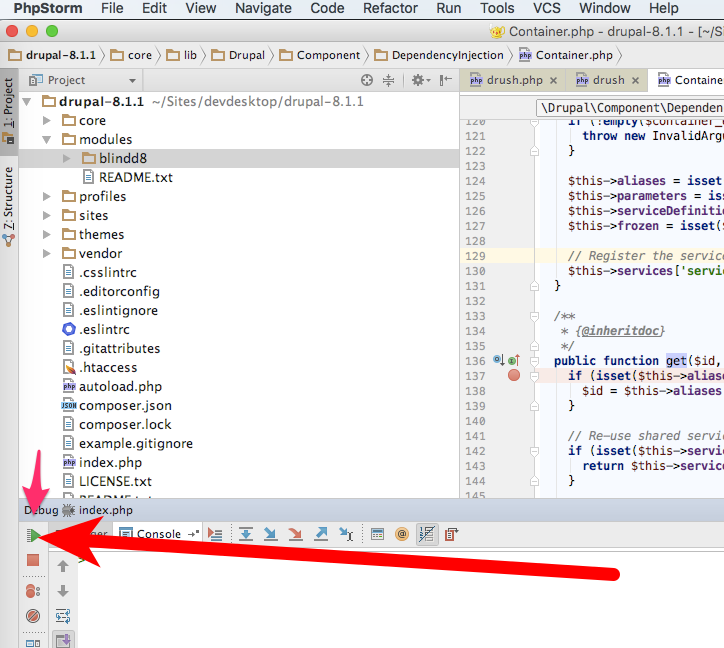
In this case, if you click into "Debugger" tab, you will see something like this:
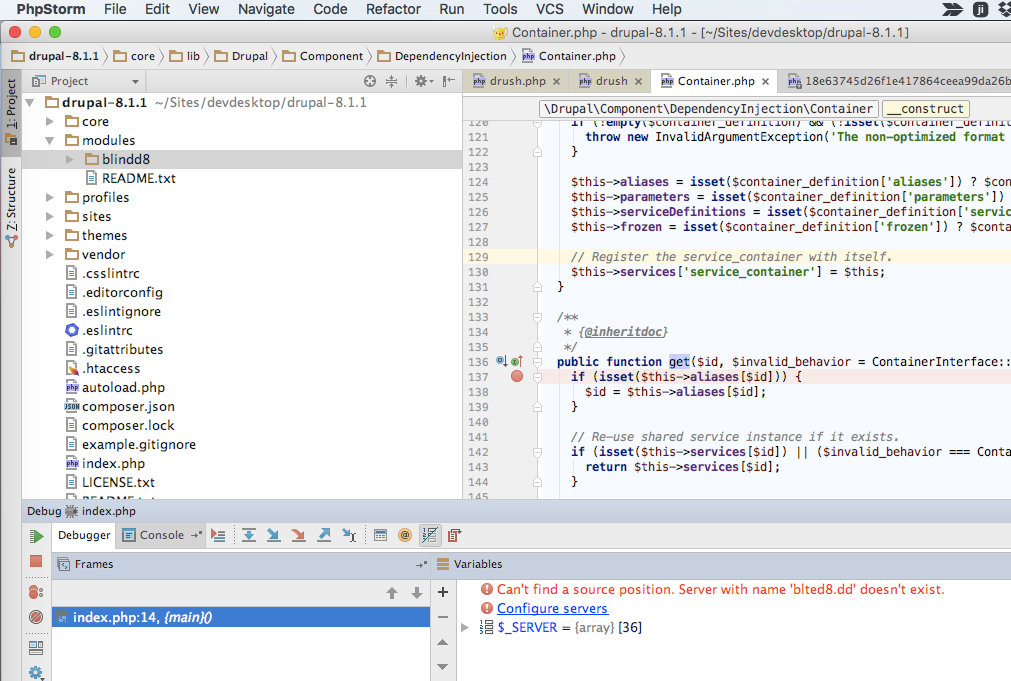
In this case, you are most likely dealing with an incorrect posting of the PHP_IDE_CONFIG variable from CLI correctly (see point 1 of this tutorial). Type
echo $PHP_IDE_CONFIGinto Terminal to see the actual value that Terminal is posting. Compare it with value you entered into ~/.bash_profile and with the server you see in PhpStorm / Preferences, section Languages & Frameworks / PHP /Servers. These names must match.
- First check if you correctly inserted your server name into PHP_IDE_CONFIG. This is the most common cause. You can determine this if PhpStorm is not showing debugging cursor in source code, but it is offering you the red debugging arrow to run through:
- The debugger is not invoked at all
- Revisit this part of tutorial, check troubleshooting in Part 1 of this series and try to repeat this process. If nothing helps, you can enable logging on XDebug if you replace following line in ~/.bash_profile :
alias phpdebug='XDEBUG_CONFIG="remote_enable=on remote_log=/tmp/xdebug.log" php -dzend_extension=$XDEBUG_PATH'Do not forget to restart Terminal window after change, then run phpdebug index.php again in your docroot.
You should see the log results in /tmp/xdebug.log . Here you can determine if the connection between xdebug and PhpStorm was established and if not, for what reason.
- Revisit this part of tutorial, check troubleshooting in Part 1 of this series and try to repeat this process. If nothing helps, you can enable logging on XDebug if you replace following line in ~/.bash_profile :
7. In Drupal, you typically don't need to debug plain php script. Rather than that, you need to debug your code using Drupal Console, drush or run unit tests using phpunit. In step 3 we created aliases for all three of these in our ~/.bash_profile file:
- drushdebug
- drupaldebug
- phpunitdebug
You can add aliases to additional apps you want to debug in a similar way. Simply add an alias into your ~/.bash_profile file on a similar principle as the existing aliases are.
8. Debugging Drupal Console
Set breakpoint on first line inside \Drupal\Component\DependencyInjection\Container::get() method (as we did in Part 1)
In Terminal enter drupaldebug container:debug under your docroot. This normally lists the Drupal 8 services, so we expect the code to be stopped inside of the method above.
Very likely, you will not have Drupal Console source code in your project. That's why you will first see a message that the debugger cannot compute source position:
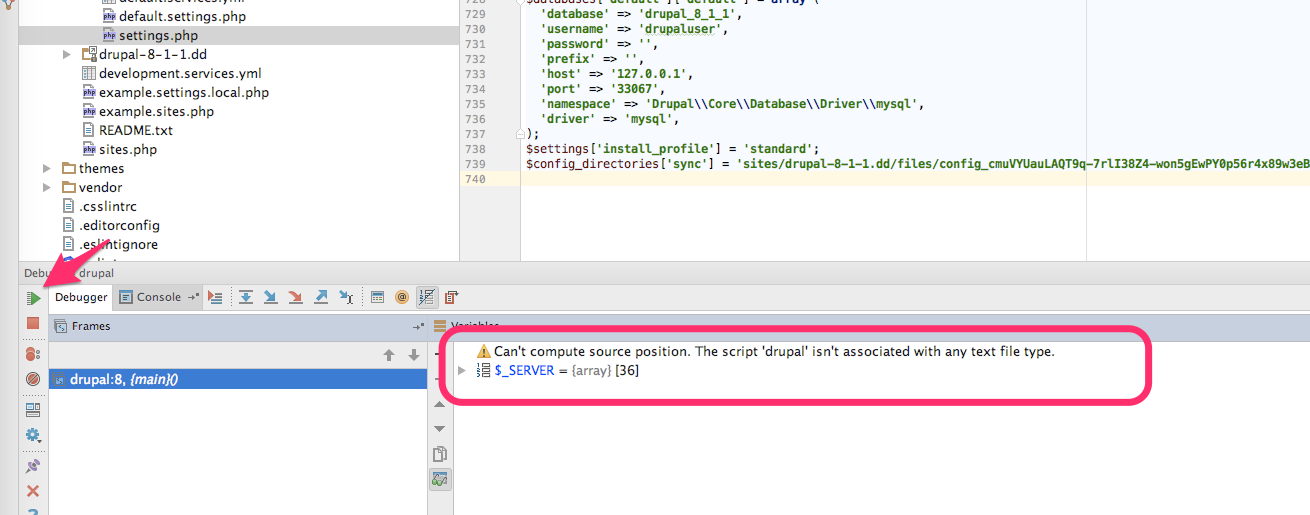
In this case, it's a correct behavior, as we don't expect to debug Drupal console source code. Click on green "play" button. In correct setup, script should be stopped afterwards inside of Container::get() where we set a breakpoint before:
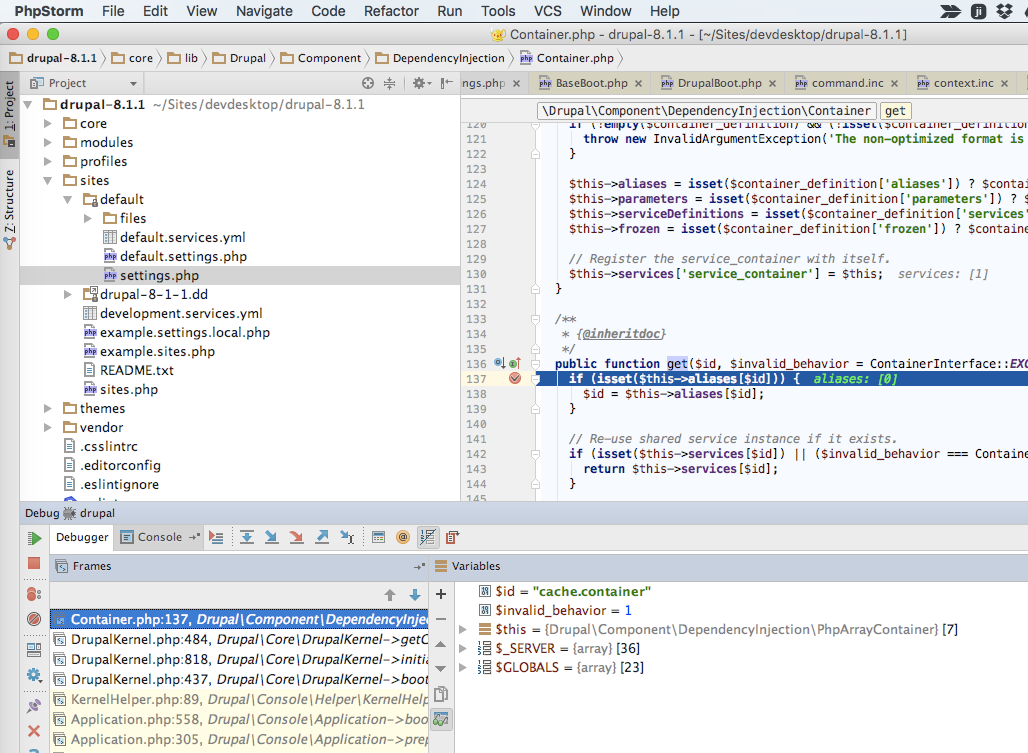
Note: In an earlier part of this tutorial we analyzed the most important debug windows closer.
9. Debugging Drush
In a similar way, you can invoke debugging on Drush command. Check it on the command drushdebug status.
If only Drush debugging doesn't work and others do, it may likely mean that the php.ini drush uses does not load XDebug debugger inside. Yes, Drush uses its own php binary and php.ini, which may be (and mostly is) different from default php.ini! However, with Acquia Dev Desktop and the setup from Part 1 of this tutorial it actually should work out of the box. See the explanation at the end of this article for the reason why.
10. Debugging phpunit
Similar to the Drupal console, you can invoke phpunit debugging (assuming phpunit is installed). Simply type phpunitdebug instead of phpunit, e.g. phpunitdebug path/to/MyClassToTest.php
Some technical background
In CLI debugging generally you are facing two major differences in comparison to web-based debugging.
Difference 1: No automatized switching of debugging on/off
Unlike in a browser, you don't have any fancy green icon you could switch debugging on or off with. Yet worse, you cannot leave XDebug enabled for all CLI processes. This would generally mean that all PHP scripts would invoke debugging environment (and remember also that scripts like composer, drush or phar are in fact php scripts), which is slow, annoying and confusing.
In general, there are three approaches to get rid of this limitation:
- Enable XDebug globally for all CLI commands and remember to disable it always in IDE
- Load disabled XDebug plugin in CLI’s php.ini and enable it only on demand using the
XDEBUG_SETTING=”remote_enable=on”directive - Do not load XDebug plugin in CLI and load it only with certain aliases, like for example „drushdebug“ that will run Drush with debugger enabled.
The first option is definitely not recommended. Due to human factors, I was stuck a lot of times with a "frozen" script that launched the debugger in a background when I didn't want to and I forgot to switch debugging in PhpStorm. In addition, it makes running all the CLI scripts significantly slower.
The second option was for a long time preferred by me. However, lately tools like Composer have started fighting against this practice – they detect XDebug in background and if they find it running, they throw warnings about the script's performance. I can understand it as people then complain about performance on the wrong shoulder. In addition, there are still some more complex points in setting up of this method.
That's why I presented you a third option in this tutorial. This one has some drawbacks too - especially in the fact that you need to define an alias for each php application you want to enable debugging for. But in general I find it not as bad as the previous two options.
Difference 2: Acquia Dev Desktop is not usable for CLI scripts (except MySQL)
Acquia Dev Desktop will almost not help you with the debugging setup. Namely, Dev Desktop uses PHP only as a part apache service. For CLI scripts, you typically need different php.ini modified specifically for CLI purposes. Unlike different *AMP stacks, Dev Desktop does not offer this.
Luckily, MAC OS X El Captain has one php interpreter pre-installed and it's fine to use it for our purposes. However, if you are not comfortable with the pre-installed php version (5.5 at the moment), you must install your own php interpreter, independent from DevDesktop.
Nevertheless, Dev Desktop is important because of its pre-installed Drush 8. Thanks to this, we can “borrow” the pre-defined path to installed Drush for creating the drushdebug alias. Any other solution would be more complicated, as installing a newer Drush version compatible with Drupal 8 is not completely straightforward today (usually you get only version 5.x which is incompatible with Drupal 8). So having it shipped together with Acquia Dev Desktop is a very comfortable and simple option. The important thing, however, is: Drush in Dev Desktop uses its own php binary! In our case, this binary is part of Acquia Dev Desktop and the php.ini used is thus the same as we already defined in web-based debugging. That means this php.ini already loads an XDebug extension inside. So we do not need to set -dzend_extension=$XDEBUG_PATH for Drush. You need to keep this in mind if you would be setting up your own (different) Drush for debugging – you must load xdebug.so in php.ini that is used by Drush and separate it from php.ini used by standard php interpreter.


