Introduction
Welcome to my series of blogs about debugging in Drupal 8.
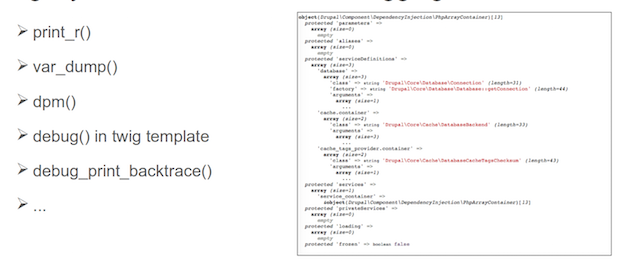
The reason why I decided to create this series is that a lot of Drupalists use ”legacy” ways of non-interactive debugging based on php-native commands like print_r(), var_dump(), debug_print_backtrace() or commands provided by contributed modules or themes like dpm() or dump() inside of twig templates.

Even though it's completely valid to use these commands to quickly display the value of a random variable, and to do simple (re-)search based on that, they have significant drawbacks compared to real interactive debugging. To name a few:
- The output is going to be very confusing on big data structures.
- Ajax responses are very difficult to track.
- It risks leaving debug commands in production code.
- There is no possibility to inject debug command into generated files (e.g. from twig).
- The calls stack is not interactive.
- Nobody knows what happens on the next line (until we reload the page).
Some of these drawbacks are even more significant in Drupal 8. The object-oriented structure in Drupal 8 means we are working with very complex objects (and they are complex for a good reason). However, a lot of people are ”scared” of the debugging setup. With excuses like ”printing a variable works everywhere,” or ”I don't have the time to set up debugging,” they opt for the quick variable dump approach to dig deeper into these structures, similar to how we used to do it in earlier Drupal versions.
I think it's definitely worthwhile to invest time into a proper debugging setup, as the investment will definitely yield significant returns in the long run. In addition, with modern tools like the PhpStorm and XDebug browser plugins, the debugging setup is already much simpler than it used to be.
In this series, I will show you the basic steps on how to to set up debugging on a few commonly used developer environments.
The truth is, we all use somewhat different setups. Some will use VMs, some will use local stacks. To make these tutorials easier to follow, I am going to use the same implementation approach (with adjustments to the specifics of each environment).
The use cases are the following:
- Web-based Drupal 8 application installed on local development PC (e.g. LAMP-Stack or Acquia Dev Desktop)
- CLI script installed on local PC, launched using drush command or Drupal console
- Web-based Drupal 8 application installed on virtual machine (e.g. Vagrant or Docker)
- CLI script launched from virtual machine (e.g. vagrant or docker), debugged on host
Each use case requires a different debugging setup; I sorted them above according to complexity of this setup (first use case has the simplest complexity).
You will find the details for each of these use cases in followup blog posts, coming shortly.
Specifications of the environments I will be using
The following environments will be used for the tutorials:
- Max OSX as an operating system (latest, v. 10.11.5 to date)
- Google Chrome as a web browser (latest, v. 51.0.2704 to date)
- PhpStorm as a development IDE (latest, v2016.2 to date)
- XDebug as a php debugging extension (2.2.3 compatible with PHP 5.5)
- Acquia Dev Desktop 2 as a local development *AMP-Stack for Drupal with PHP 5.5 used (higher PHP version should be supported too with corresponding higher XDebug version)
For use cases 3 and 4 I've chosen Drupal VM as a Vagrant-based full-featured enterprise development environment.
Even though the tutorials will be tested with the environments above, they should be applicable to different operating systems (Linux, Windows), albeit with slight changes. Keep in mind that on Windows you should be aware of the different path syntax and difficulties, and that the setup of supporting PHP tools like Drush or Drupal Console is assumed (since their setup would go beyond the scope of the series).
setup of supporting PHP tools like Drush or Drupal Console is assumed (since their setup would go beyond the scope of the series).


